What Is VWAP? How Traders Use Volume-Weighted Average Price
What Is VWAP? How Traders Use Volume-Weighted Average Price
If you have ever watched an active intraday chart, you have likely noticed that price rarely moves in a vacuum. A stock might surge three percent on thin pre-market turnover, only to stall the moment regular trading volume floods the order book. Price tells you where an asset is trading, but volume tells you how much conviction sits behind that move.
This dynamic is exactly why professional desks and retail day traders rely heavily on the VWAP indicator (Volume-Weighted Average Price). Unlike traditional moving averages that treat every minute of the session equally, VWAP ties price directly to transaction volume. It reflects the true average price paid per share or contract across the entire trading day.
In this guide, we break down what the VWAP indicator is, how to interpret price positioning around it, how to read intraday context, and the common pitfalls you need to avoid.
1. What Is the VWAP Indicator and How Does It Work?
At its core, the VWAP indicator calculates the cumulative dollar value of all trades divided by the total cumulative volume traded during a specific session.
Most technical indicators—such as the Simple Moving Average (SMA) or Exponential Moving Average (EMA)—calculate an average based exclusively on closing prices across arbitrary candle counts (like 9, 20, or 50 periods). If ten shares trade at $100 and one million shares trade at $102, a standard moving average weighs both prices identically. VWAP, by contrast, weights that one-million-share transaction heavily, pulling the benchmark right toward the actual capital flow.
The Math Behind the Line
While modern trading platforms calculate VWAP automatically in real time, understanding the logic helps you interpret what the line actually represents:
- Typical Price (TP):
(High + Low + Close) / 3for each intraday candle. - Volume-Weighted Value:
Typical Price × Volumefor that bar. - Cumulative Sums: Keep a running total of
(Typical Price × Volume)and divide it by the running total ofVolumesince the market open.
Because the calculation resets at the start of each new trading session, VWAP is primarily an intraday tool. When you track live quotes and technical indicators inside Trade AI Market Data, you can observe how this reference line forms right from the opening bell.
2. Intraday Context: The True Benchmark for Fair Value
To understand why the VWAP indicator carries so much weight on active charts, look at who uses it. Institutional market participants—such as mutual funds, pension funds, and algorithmic execution desks—rarely buy or sell their entire position in a single order. Dumping hundreds of thousands of shares into the market all at once causes massive slippage.
Instead, institutions break large parent orders into smaller child orders spread out across the session. Their primary execution goal is simple: beat the market average price.
Institutional Efficiency
- Buying Below VWAP: If an institutional buyer executes an accumulation program at an average fill price lower than VWAP, their execution is considered favorable (they purchased at a discount relative to the volume-weighted session average).
- Selling Above VWAP: If an institutional seller liquidates stock above VWAP, they secured liquidity at a premium.
Because large players use VWAP as an efficiency benchmark, significant buying interest often emerges when an uptrending stock pulls back toward the line. Similarly, heavy selling resistance often appears when a downtrending asset rallies up into VWAP. It functions as an invisible fulcrum for intraday market balance.
For a deeper look into the mechanics of institutional volume and execution metrics, review educational overviews such as Investopedia's Guide to Volume Weighted Average Price.
3. Reading Price Positioning: Bullish vs. Bearish Intraday Bias
How do retail traders use this information practically? Price positioning relative to the VWAP indicator serves as an immediate intraday trend filter.
[ Price Trending Above VWAP ] → Buyers in Control / Premium
============================== (VWAP Line / Fair Value)
[ Price Trending Below VWAP ] → Sellers in Control / Discount
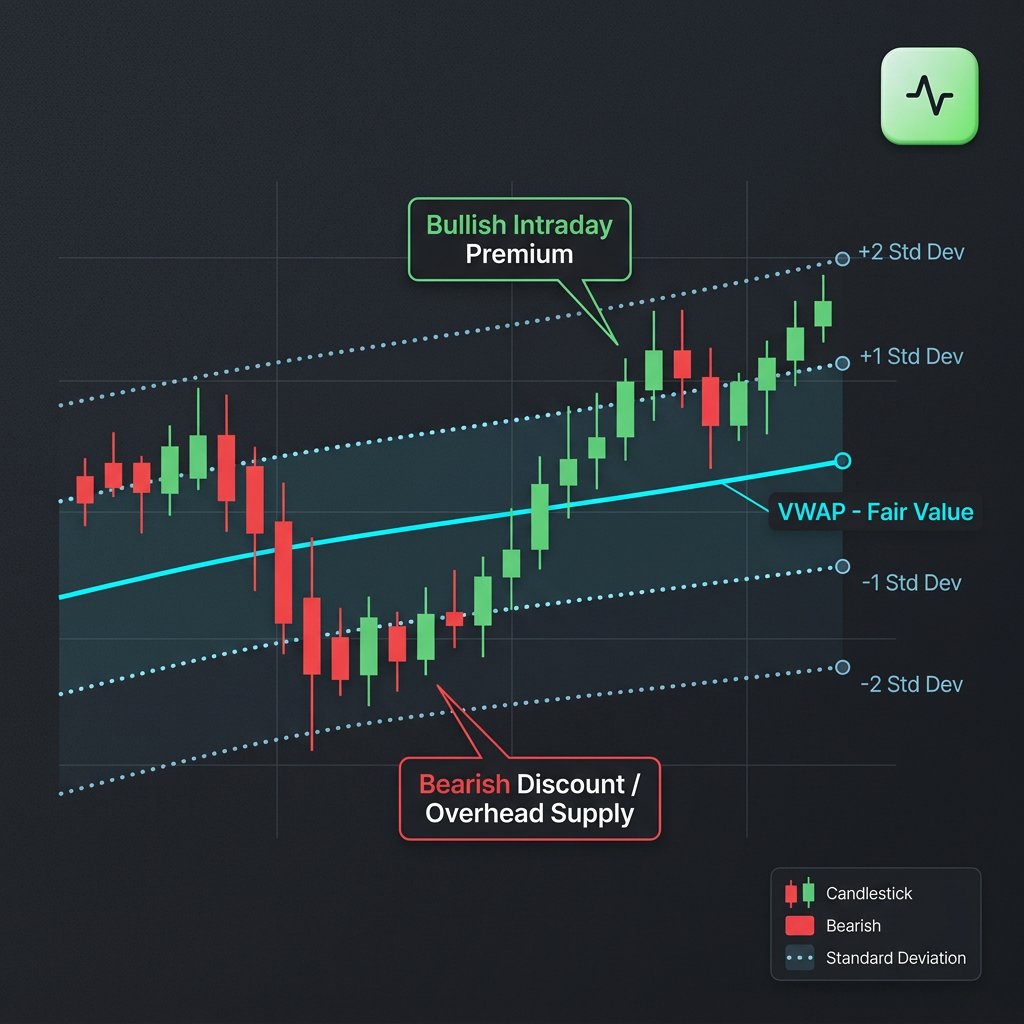
Above VWAP: Bullish Control
When price sustains above the VWAP line, the average buyer for the session is currently in profit. Buyers are willing to pay above fair value to build exposure, signaling upward momentum. In this environment, day traders often prioritize long setups or look for pullbacks toward the line that confirm support.
Below VWAP: Bearish Control
When price trades beneath the VWAP line, the average participant who bought during that session is underwater. This creates overhead supply: any push back toward the line often triggers selling from trapped longs looking to exit at break-even. Traders frequently treat the space below VWAP as a zone for short bias or defensive risk management.
VWAP Standard Deviation Bands
Many charting setups envelope the VWAP indicator with upper and lower standard deviation bands (often ±1, ±2, and ±3 standard deviations).
- Mean Reversion: When price extends past the +2 standard deviation band without fresh catalyst volume, it is statistically stretched, often prompting a pullback toward the mean.
- Trend Continuation: In powerful breakout sessions, price can hug the upper standard deviation band for hours, signaling an aggressive imbalance where sellers have stepped aside entirely.
4. Practical Trading Applications and Smart Confirmation
While the VWAP indicator provides clear reference points, relying on any single indicator in isolation can lead to whipsaws. Combining VWAP with pattern recognition and volume analysis creates a much clearer picture.
The VWAP Bounce
One of the most common setups involves waiting for a leading morning mover to pull back toward VWAP between 10:30 AM and midday. Rather than buying blindly as soon as price touches the line, wait for confirmation:
- Price tests the VWAP line.
- Volume decreases on the pullback (indicating low selling conviction).
- A bullish reversal candle prints, followed by an uptick in buy volume.
Multitasking Your Analysis with Trade AI
If you are tracking multiple tickers across equities, crypto, and forex, monitoring every intraday pullback manually is exhausting.
You can upload your charts or inspect live symbols directly through Trade AI AI Chart Analysis. The platform's automated vision tools scan candlestick structures, key support and resistance zones, and session dynamics simultaneously. By pairing structural chart patterns with your VWAP observations, you verify whether a pullback to the indicator aligns with broader market structure.
If you want to practice trading VWAP bounces or standard deviation fade setups without risking real capital, you can test ideas inside the Trade AI Trading Simulation. This lets you experience how fast price reacts around volume nodes during live market hours.
5. Limitations of the VWAP Indicator
Despite its popularity, the VWAP indicator is not a magic crystal ball. Recognizing its blind spots will keep you from taking low-probability trades.
1. Cumulative Lag Later in the Session
Because VWAP calculates cumulative data starting from the opening print, the volume denominator grows substantially throughout the day. By 2:30 PM, it takes a massive surge of new volume to budge the VWAP line even a fraction of a percent. As a result, VWAP becomes sluggish in the afternoon, behaving more like a lagging flatline than a responsive guide.
2. Not Suitable for Multi-Day Swing Trading
Standard VWAP resets every single day. If you are holding positions for days or weeks, a standard intraday VWAP line provides zero context on where multi-week buyers accumulated shares. While anchored VWAPs (anchored to specific earnings dates or swing lows) can help swing traders, standard VWAP remains strictly an intraday metric.
3. False Breakouts in Choppy Markets
During quiet, range-bound sessions with low overall market participation, price will often crisscross the VWAP line dozens of times without any directional follow-through. Treating every cross of the VWAP indicator as a buy or sell trigger during consolidation results in frustrating chop.
Summary / Key Takeaways
- Volume-Weighted Reality: The VWAP indicator represents the true average price of an asset throughout the current trading session, weighted by actual transaction volume rather than just closing ticks.
- Institutional Compass: Large institutional desks use VWAP to evaluate trade execution quality, making the line a natural area for liquidity and institutional interest.
- Trend & Value Filter: Trading above VWAP signals intraday bullish strength; trading below points to seller control and potential overhead supply.
- Intraday Dynamic: Because the calculation resets every morning, VWAP is primarily an intraday tool and becomes progressively more sluggish into the afternoon close.
- Context Is Critical: Never trade VWAP crosses blindly. Use volume confirmation, technical chart patterns, and broader multi-asset sentiment to validate the setup.
Step Up Your Market Analysis
Understanding indicators like VWAP is the first step toward building a structured, objective routine. When you pair volume-weighted indicators with automated market tools, you spend less time second-guessing charts and more time focusing on disciplined execution.
Explore real-time data, test strategies in risk-free simulation environments, and unlock automated pattern detection with Trade AI.
Start Your Market Analysis on Trade AI Today
Frequently Asked Questions
What is the difference between VWAP and a Simple Moving Average (SMA)?
A Simple Moving Average calculates the arithmetic mean of closing prices over a specific number of periods, treating every bar equally. The VWAP indicator accounts for volume, ensuring high-volume price levels exert a stronger influence on the calculation than low-volume periods.
Can you use the VWAP indicator for swing trading?
Standard VWAP resets daily at the market open, making it strictly an intraday indicator. For swing trading over multiple days or months, traders typically use an "Anchored VWAP" (AVWAP), which starts calculating from a chosen event such as an earnings release, major high, or monthly open.
Why does VWAP flatten out in the afternoon?
VWAP aggregates cumulative price and volume data from the start of the session. As the trading day progresses, the accumulated volume becomes so large that fresh trades in the afternoon represent only a tiny fraction of the total pool, causing the line to become less responsive.
Does VWAP work on cryptocurrency and forex markets?
Yes, but with caveats. VWAP requires accurate volume data. In equities and centralized futures, volume is unified. In decentralized markets like spot forex or fragmented crypto exchanges, VWAP calculations depend on the specific exchange feed or tick-volume proxy being measured.
Disclaimer: Trade AI provides AI-generated market analysis, signals and insights for informational and educational purposes only. This content does not constitute financial, investment or trading advice, nor is it a recommendation to buy or sell any financial instrument. Markets are inherently unpredictable, and past or AI-generated analysis does not guarantee future results. Always conduct your own research and apply appropriate risk management before making any financial decision.
Frequently asked questions
- What is the difference between VWAP and a Simple Moving Average (SMA)?
- A Simple Moving Average calculates the arithmetic mean of closing prices over a specific number of periods, treating every bar equally. The VWAP indicator accounts for volume, ensuring high-volume price levels exert a stronger influence on the calculation than low-volume periods.
- Can you use the VWAP indicator for swing trading?
- Standard VWAP resets daily at the market open, making it strictly an intraday indicator. For swing trading over multiple days or months, traders typically use an Anchored VWAP (AVWAP), which starts calculating from a chosen event such as an earnings release, major high, or monthly open.
- Why does VWAP flatten out in the afternoon?
- VWAP aggregates cumulative price and volume data from the start of the session. As the trading day progresses, the accumulated volume becomes so large that fresh trades in the afternoon represent only a tiny fraction of the total pool, causing the line to become less responsive.
- Does VWAP work on cryptocurrency and forex markets?
- Yes, but with caveats. VWAP requires accurate volume data. In equities and centralized futures, volume is unified. In decentralized markets like spot forex or fragmented crypto exchanges, VWAP calculations depend on the specific exchange feed or tick-volume proxy being measured.