What Is AI-Powered Chart Analysis and How Does It Work?
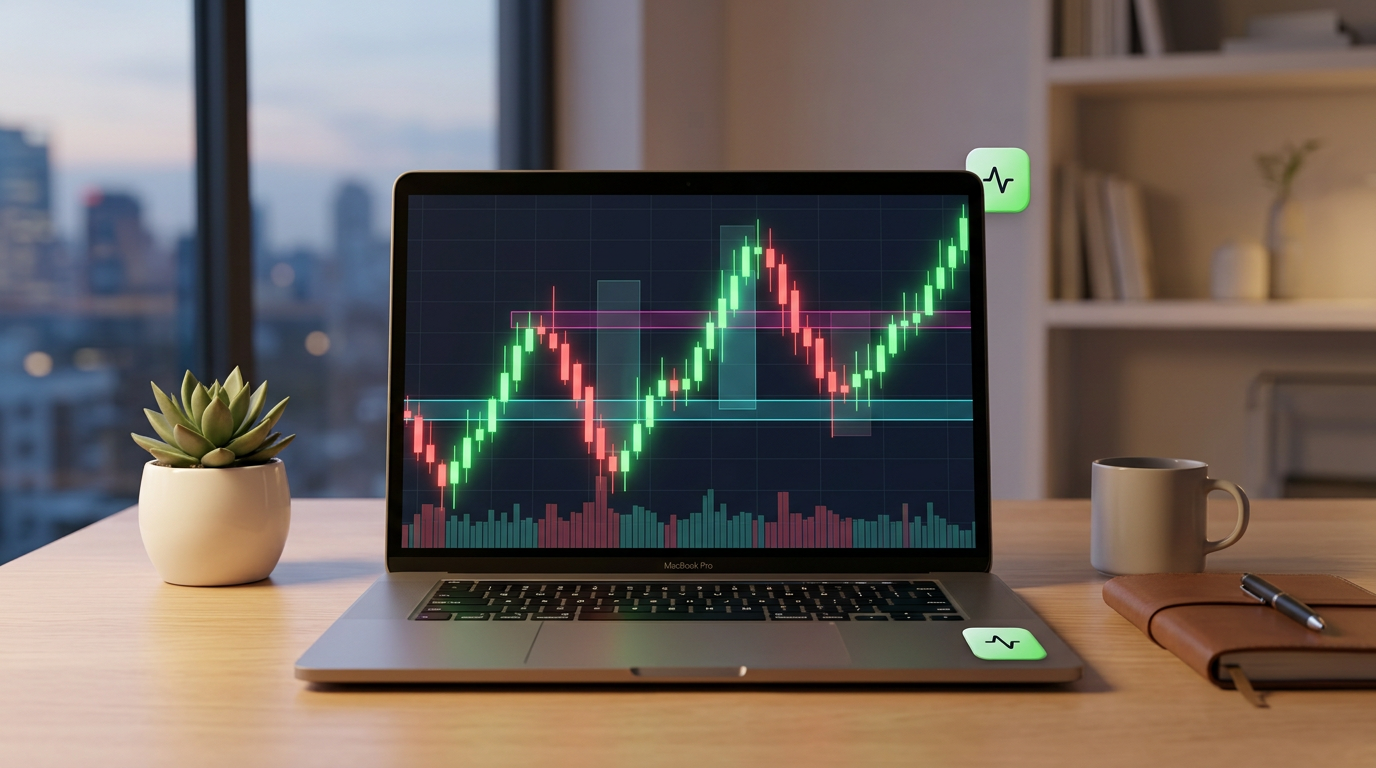
What Is AI-Powered Chart Analysis and How Does It Work?
If you have ever spent hours squinting at candlestick charts, manually drawing trendlines, and debating whether a pattern is a true double bottom or a fakeout, you know how mentally exhausting technical analysis can be. For decades, chart reading was reserved for experienced technical analysts with specialized software or institutional desks equipped with proprietary quantitative models.
Today, artificial intelligence is reshaping how retail traders study financial markets. AI-powered chart analysis bridges the gap between raw price history and actionable market context. Rather than relying on guesswork, intuition, or tired eyes after a long day, traders can now leverage computer vision and machine learning models to identify chart structures, pinpoint key support and resistance zones, and evaluate multi-asset trends in seconds.
In this guide, we break down what AI-powered chart analysis is, examine the mechanics behind how it works, and show how individual traders can use these tools to build a more structured, objective market research routine.
Understanding the Basics: What Is AI-Powered Chart Analysis?
At its core, AI chart analysis is the application of artificial intelligence—specifically machine learning and computer vision—to financial price charts. Instead of requiring a trader to manually plot every trendline, identify geometric structures, and calculate mathematical pivot points, an AI engine evaluates market data directly to highlight high-probability technical setups.
In traditional technical analysis, traders rely on historical price action (Open, High, Low, Close, and Volume, or OHLCV data) to anticipate future market behavior. Classic charting revolves around visual patterns, such as:
- Reversal patterns: Head and shoulders, double tops, double bottoms, and inverse head and shoulders.
- Continuation patterns: Bull and bear flags, pennants, and symmetrical triangles.
- Key levels: Horizontal support, resistance shelves, and supply/demand zones.
While traditional technical analysis works well in theory, human execution often falls short due to cognitive bias and visual fatigue. A trader holding a long position is far more likely to see a bullish pennant, even when the underlying price action is rolling over into a breakdown.
AI-powered chart analysis removes that emotional lens. By processing price movements objectively against historical models, AI systems highlight patterns based on mathematical structure rather than wishful thinking. According to market educational resources from Investopedia, consistent technical analysis depends on disciplined rule-following—an area where algorithmic pattern recognition excels.
How Does AI Chart Analysis Actually Work Behind the Scenes?
AI chart analysis does not rely on magic, crystal balls, or guaranteed market predictions. Instead, it operates through a series of structured computational layers that transform unstructured visual charts and raw numerical price series into clear, organized observations.
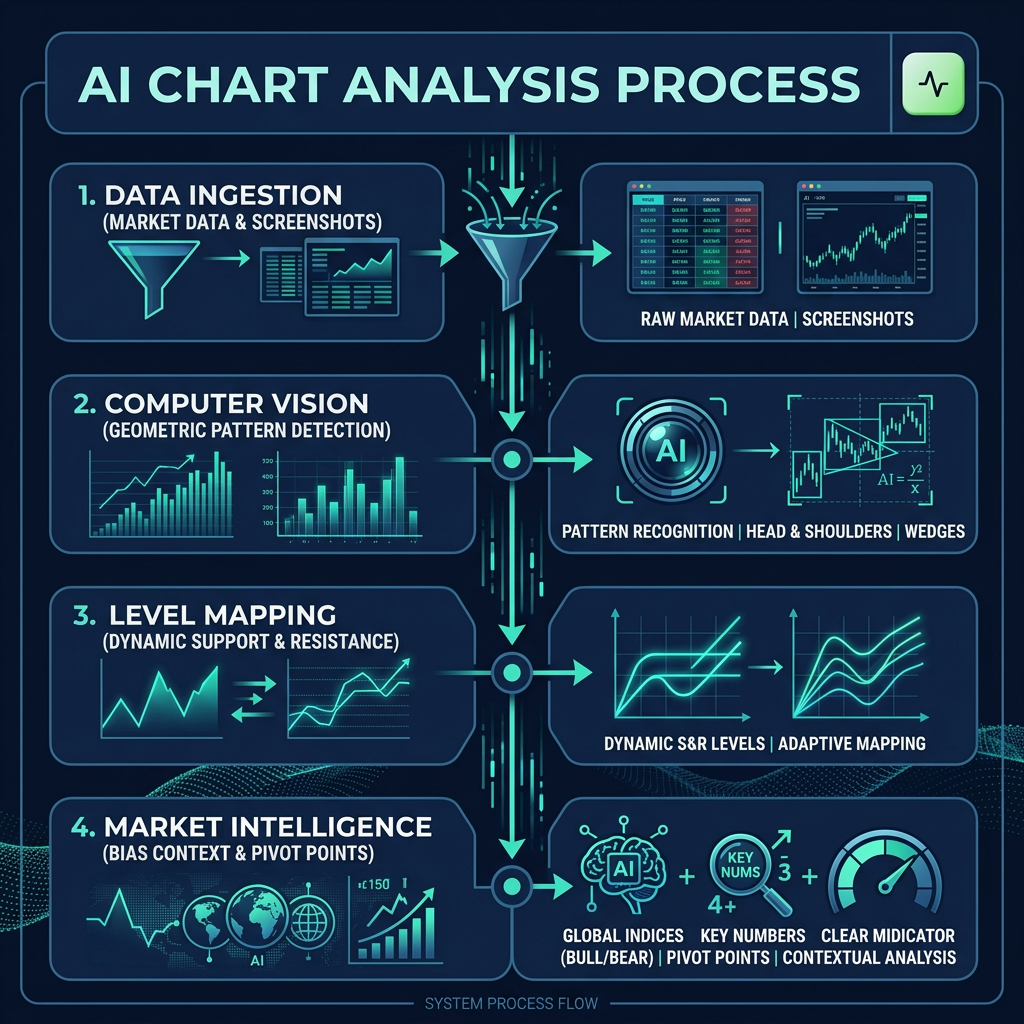
1. Data Ingestion and Normalization
Before an AI can read a chart, it needs clean data. This happens in one of two ways:
- Direct Market Feeds: The platform pulls live or historical tick, minute, or daily OHLCV data across stocks, crypto, forex, or commodities.
- Computer Vision on Uploaded Images: Some modern platforms allow you to upload a screenshot of your own trading chart. The AI uses image processing to detect candlestick bodies, wicks, coordinate axes, and timeframes.
Once imported, the data is normalized. This ensures that a 5% swing on a volatile cryptocurrency like Bitcoin is evaluated appropriately compared to a 0.5% move on a major currency pair like EUR/USD.
2. Geometric Pattern Recognition
Historically, algorithmic chart screeners relied on rigid, hard-coded rules (e.g., "Candle A must be exactly 1.2 times larger than Candle B"). If a real-world market pattern was slightly asymmetrical, the script would miss it entirely.
Modern AI uses machine learning models trained on millions of historical market charts. The algorithm recognizes that genuine market patterns are rarely textbook-perfect. By evaluating relative highs, lows, and momentum slopes, the AI identifies formations like ascending triangles or falling wedges even when market noise makes them messy to the human eye.
3. Dynamic Support and Resistance Mapping
Support and resistance levels represent price zones where buying or selling pressure has historically concentrated. Instead of simply drawing a horizontal line across a single swing point, an AI engine analyzes volume clusters, order block zones, and repeated price rejections.
This creates dynamic zones rather than brittle lines. The system highlights where price is statistically most likely to find liquidity, pause, or reverse.
4. Contextual Synthesis and Bias Detection
Once patterns and key levels are identified, the AI synthesizes these data points into an easy-to-read summary. Rather than spitting out confusing mathematical outputs, the system presents a readable technical narrative: current trend bias (bullish, bearish, or neutral), primary support and resistance levels, and nearby chart formations.
On platforms like Trade AI, this functionality is integrated directly into the user interface. You can analyze a symbol using live market feeds or simply upload a chart screenshot to receive an instant breakdown of patterns, support/resistance levels, and market bias.
Key Benefits of AI Chart Analysis for Retail Traders
Retail traders face challenges that institutional desks do not: limited time, multiple distractions, and fragmented tools. Introducing AI into your chart routine provides several distinct advantages.
Eliminating Confirmation Bias
One of the biggest hurdles in retail trading is seeing what you want to see. When you are excited about an asset, your brain naturally hunts for bullish signals and dismisses warning signs. An AI engine does not have an open position, an ego, or fear of missing out. It reads the chart strictly as the data presents itself.
Saving Research Time Across Multiple Markets
Keeping tabs on equities, forex pairs, and crypto tokens simultaneously is exhausting. With automated chart analysis, you can screen a watchlist of dozens of assets in minutes. The AI highlights which charts are showing clear structural formations, letting you spend your energy reviewing high-quality setups rather than endlessly scanning empty charts.
Accelerated Technical Learning
For beginners and intermediate traders, AI chart analysis acts as an interactive coach. If you are learning how to spot a complex head-and-shoulders pattern, having the AI highlight the neckline, left shoulder, head, and right shoulder validates your own technical observations and speeds up your learning curve.
How to Integrate AI Chart Analysis into Your Daily Routine
AI is a powerful tool, but it works best when integrated into a well-defined personal research framework. Here is a practical, four-step routine you can apply using platforms like Trade AI:
Step 1: Scan Your Watchlists
Organize your assets into dedicated watchlists—such as large-cap stocks, major forex pairs, or blue-chip crypto tokens. Use AI tools to quickly inspect the daily and 4-hour charts to see which markets are trending and which are consolidating.
Step 2: Confirm Multi-Timeframe Alignment
A setup on a 15-minute chart is significantly stronger when it aligns with the trend on the daily or weekly chart. Run AI chart evaluations across multiple time horizons. If the daily chart shows strong support and the hourly chart forms a bullish flag, you have established multi-timeframe confluence.
Step 3: Layer with Macro and Sentiment Context
Charts reflect price action, but external events drive volatility. Complement your technical chart observations with market news and AI-driven sentiment analysis. Understanding whether incoming news flow aligns with a technical breakout helps you avoid buying into a pattern right before a major macroeconomic release.
Step 4: Validate in a Simulated Environment
Before committing hard-earned capital to any new trading hypothesis, practice your ideas risk-free. Using Trade AI's trading simulation tools, you can paper-trade ideas based on AI chart breakdowns, test your entry and exit discipline, and observe how setups play out under live market conditions without financial risk.
Using AI Chart Tools on the Go
Market-moving technical developments do not wait until you are sitting at your desk. Modern retail traders need access to quick chart insights whether they are commuting, traveling, or away from their multi-monitor setup.
Trade AI enables this flexibility by bringing chart analysis directly into personal messaging apps. Through the Trade AI Telegram bot, users can request instant technical breakdowns or submit chart queries from their phones. This allows you to verify key support levels and chart setups on the fly without needing to launch heavy desktop charting software.
Moreover, disciplined market research also requires mental breaks. To keep traders refreshed between market sessions, Trade AI introduced the Trade AI Arcade, featuring market-themed mini-games like Candle Runner and Trade Flap. By engaging in platform research, running chart analyses, and exploring features, users earn XP and TCoins to unlock cosmetic badges and game achievements—making market education engaging and interactive.
Common Misconceptions About AI Chart Analysis
To make the most of artificial intelligence in financial markets, it is vital to separate reality from marketing hype.
- Myth: "AI can predict the market with 100% certainty."
Reality: Markets are probabilistic systems influenced by unpredictable human behavior and global events. AI identifies patterns and shifts in momentum, but no algorithm can guarantee future price direction. - Myth: "AI replaces personal risk management."
Reality: AI helps with research and visual processing, but position sizing, stop-loss placement, and risk control remain entirely in the trader's hands. - Myth: "AI charting is only for quantitative hedge funds."
Reality: Modern web tools make advanced computer vision and machine learning accessible to everyday retail traders directly in their browsers. - Myth: "You must know how to code to use AI analysis."
Reality: Today's platforms are built with intuitive, conversational interfaces. You simply select a ticker or upload an image to receive instant, plain-English analysis.
Organizations like the Financial Industry Regulatory Authority (FINRA) consistently emphasize that investors must understand the tools they use and never rely blindly on automated outputs. Treat AI as a research partner, not an automated financial advisor.
Summary & Key Takeaways
- Objective Visual Analysis: AI-powered chart analysis uses machine learning and computer vision to identify patterns, trend biases, and support/resistance zones without emotional bias.
- Flexible Data Inputs: Platforms like Trade AI can analyze real-time market data across equities, crypto, forex, and commodities, or evaluate uploaded chart screenshots directly.
- Efficiency for Retail Traders: Automating pattern recognition saves hours of manual charting and lets you scan multiple timeframes and asset classes rapidly.
- Essential Educational Companion: Reviewing AI-generated structural breakdowns helps beginners and intermediate traders learn chart geometry and improve visual discipline.
- Risk Management Remains Essential: AI is an informational tool that enhances market research. Always combine AI chart insights with solid risk management, multi-source research, and simulated practice.
Explore Trade AI Today
Ready to elevate your market research and eliminate the guesswork from chart reading? Whether you want to scan live market feeds, analyze uploaded chart screenshots, or test your strategies risk-free in a simulated environment, Trade AI puts sophisticated market intelligence at your fingertips.
Start Your Market Analysis with Trade AI
Frequently Asked Questions (FAQ)
Can AI chart analysis tell me exactly when to buy or sell?
No. AI chart analysis identifies patterns, market trends, and structural price zones based on historical data. It provides informational context to help you make informed decisions, but it does not tell you with certainty what the market will do next. The final trading decision and risk management always rest with you.
Do I need to be a programmer to use AI chart analysis?
Not at all. While institutional hedge funds write custom Python scripts, platforms like Trade AI are built specifically for individual retail users. You interact with clear dashboards, intuitive chart views, and simple upload buttons—no coding or technical expertise required.
How does AI chart pattern recognition differ from standard indicators like RSI or MACD?
Standard technical indicators (such as the Relative Strength Index or Moving Average Convergence Divergence) apply fixed mathematical formulas to past price data to measure momentum or average prices. AI chart analysis goes further by using computer vision and machine learning to recognize geometric shapes, trendlines, consolidation zones, and price context across multiple dimensions, much like an expert human analyst would.
Can I analyze my own chart screenshots?
Yes. In addition to pulling live market data for major stocks, cryptocurrencies, forex pairs, and commodities, Trade AI allows users to upload screenshots of charts from any platform. The AI's computer vision engine evaluates the image to identify visible patterns, support shelves, and trend trajectory.
Is AI-powered chart analysis suitable for beginners?
Yes. Beginners often find AI chart analysis especially helpful because it acts as a visual guide. By highlighting key levels and naming chart patterns, it helps new traders learn technical analysis concepts faster while avoiding common emotional pitfalls like over-trading or misinterpreting messy charts.
Disclaimer: Trade AI provides AI-generated market analysis, signals and insights for informational and educational purposes only. This content does not constitute financial, investment or trading advice, nor is it a recommendation to buy or sell any financial instrument. Markets are inherently unpredictable, and past or AI-generated analysis does not guarantee future results. Always conduct your own research and apply appropriate risk management before making any financial decision.
Frequently asked questions
- Can AI chart analysis tell me exactly when to buy or sell?
- No. AI chart analysis identifies patterns, market trends, and structural price zones based on historical data. It provides informational context to help you make informed decisions, but it does not tell you with certainty what the market will do next. The final trading decision and risk management always rest with you.
- Do I need to be a programmer to use AI chart analysis?
- Not at all. Platforms like Trade AI are built specifically for retail users, featuring visual dashboards and intuitive screenshot upload features that require zero programming knowledge.
- How does AI chart pattern recognition differ from standard indicators like RSI or MACD?
- Standard indicators apply fixed mathematical formulas to price averages or momentum. AI chart pattern recognition uses machine learning and computer vision to evaluate geometric formations, trend structures, and liquidity zones across multiple dimensions.
- Can I analyze my own chart screenshots with Trade AI?
- Yes. Trade AI allows individual users to upload chart screenshots directly or select symbols from integrated live feeds to generate instant technical breakdowns and support/resistance analysis.
- Is AI-powered chart analysis beginner-friendly?
- Yes. It serves as an educational companion, visually identifying patterns and trend levels to help beginners learn technical analysis principles faster without emotional bias.