Streaming Multi-Asset Market Data: How to Calculate Indicators On-Demand via REST Endpoints

Streaming Multi-Asset Market Data: How to Calculate Indicators On-Demand via REST Endpoints
Designing infrastructure for algorithmic trading systems requires balancing compute overhead, data normalization, and latency. When systems scale across equities, foreign exchange (FX), digital assets, and commodities, calculating rolling technical indicators—such as Exponential Moving Averages (EMA), Relative Strength Index (RSI), and Average True Range (ATR)—presents significant state-management challenges.
Traditionally, quantitative teams have maintained persistent in-memory ring buffers and local time-series databases to calculate indicator values. However, an architectural shift toward serverless and microservice-driven quant stacks has driven demand for on-demand calculation via high-performance REST APIs. This guide explores the mechanics of multi-asset data streaming, details the architectural trade-offs between local state computation and stateless REST queries, and provides a production-grade implementation for calculating indicators on-demand.
The Multi-Asset Data Ingestion Problem
Handling multi-asset ingestion requires managing divergent market structures:
- Equities: Structured trading sessions, discrete opening/closing auctions, consolidated tape feeds (SIP), and distinct corporate action adjustments.
- Forex: Decentralized over-the-counter (OTC) quote streams, non-uniform spreads, institutional ECN matching, and Friday market closes.
- Crypto: 24/7 continuous trading, highly fragmented liquidity across global venues, heterogeneous WebSocket schemas, and irregular tick volume bursts.
Normalizing Fragmented Schemas
Before calculating an indicator, data must conform to a standardized Open-High-Low-Close-Volume (OHLCV) schema. When maintaining state locally across thousands of instruments and multiple timeframes (e.g., 1m, 5m, 1h, 1d), memory requirements multiply rapidly. If your worker process crashes, rebuilding rolling window buffers from cold storage can delay system restart by several minutes—introducing severe execution risk.
Architecture: In-Memory State vs. Stateless REST Calculation
Quant systems generally split along two design patterns when evaluating indicators on market feeds.
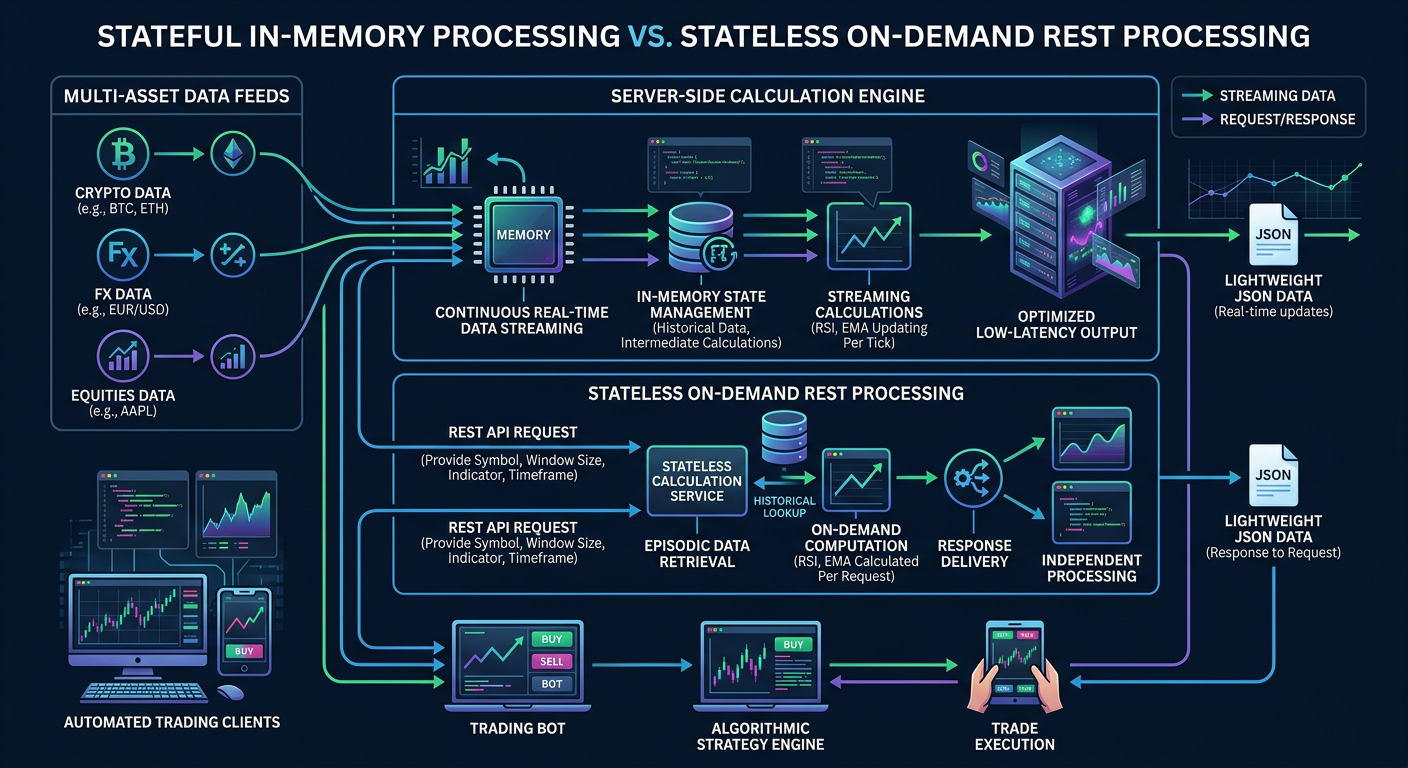
1. Local State Maintenance (Stateful)
The client continuously streams raw ticks or 1-minute bars over WebSockets, maintains an in-memory deque or pandas DataFrame, and updates indicators locally using mathematical libraries. However, this introduces high memory footprints, thread safety complexities, and vulnerability to memory leaks.
2. On-Demand Indicator Calculation (Stateless)
The client application streams or polls normalized data, delegating the rolling state calculation to an optimized server-side backend via an OHLCV technical indicators API. Worker processes remain stateless, horizontal auto-scaling is simplified, historical lookback buffers are handled externally, and calculations remain computationally identical across distributed nodes.
Mathematical Mechanics of On-Demand Indicator Calculations
To understand why offloading calculations works cleanly over REST, consider how indicators are parameterized over rolling windows.
Exponential Moving Average (EMA)
The EMA assigns exponentially decaying weights to historical prices. Calculating an EMA requires a warm-up period of at least 3N to 5N historical bars to achieve calculation convergence. In a stateless microservice, passing indicator parameters to a REST endpoint shifts this entire warm-up and recursion process to the data layer, returning only the converged value along with current boundary metrics.
Relative Strength Index (RSI)
Wilder’s RSI quantifies velocity and magnitude of directional price movements. Handling Wilder's smoothing locally requires continuous tracking of upstream gains and losses. An on-demand REST endpoint eliminates drift errors introduced when client-side streaming sockets experience dropped frames or TCP retransmissions.
Implementation: Querying Indicators On-Demand in Python
Using standard HTTP connection pooling minimizes latency when querying market data endpoints. You can query normalized indicators programmatically through standard REST interfaces:
When scaling to hundreds of tickers, synchronous queries will bottleneck execution loops. Teams should adopt standard engineering patterns such as HTTP/2 multiplexing, asynchronous I/O (via httpx or aiohttp), and conditional ETag caching.
For detailed implementation instructions and sample projects, explore our guide on integrating automated trading signals.
Regulatory and Risk Disclaimer
This content is written strictly for technical and educational purposes and does not constitute financial, investment, or legal advice. Calculating technical indicators via APIs does not guarantee algorithmic trading success. Financial markets carry substantial risk of capital loss. Past algorithmic performance does not indicate future outcomes.
Frequently asked questions
- What is the primary benefit of on-demand REST indicators over local TA-Lib calculations?
- Statelessness. By offloading historical window maintenance and mathematical convergence to a specialized API, your trading bots and workers can scale horizontally without managing gigabytes of rolling tick memory or performing slow backfill warm-ups upon deployment.
- How are corporate actions and splits handled in multi-asset indicator endpoints?
- For equities, enterprise data feeds apply historical adjustments (split and dividend factors) server-side prior to indicator execution, ensuring moving averages and oscillators reflect smooth, unmanipulated technical baselines.
- What latency can be expected when querying indicators via REST endpoints?
- Optimized REST indicator endpoints generally deliver responses within 15ms to 45ms depending on geographic proximity and connection reuse (HTTP/2 keep-alive), making them ideal for systematic strategies operating on 1-minute to daily intervals.
- Can I request multiple indicators within a single HTTP payload?
- Yes. Most modern technical indicator APIs allow batched queries, returning multiple indicator sets (e.g., RSI, Bollinger Bands, and MACD) for a given symbol in a single payload to minimize network round-trips.