RSI, MACD, EMA & VWAP Explained: Which Indicators Should You Use?
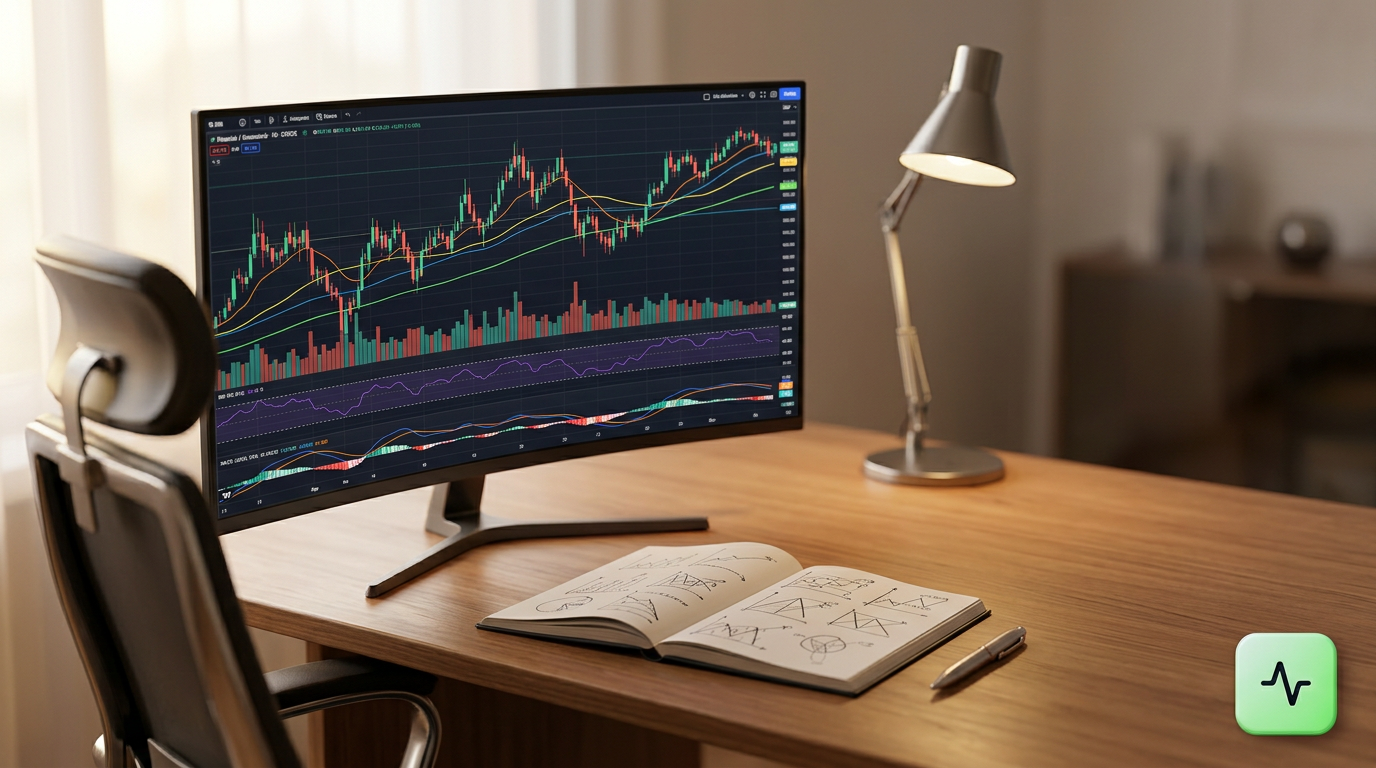
RSI, MACD, EMA & VWAP Explained: Which Indicators Should You Use?
Opening a price chart for the first time can feel overwhelming. Between candlestick bars, fluctuating volume bars, and a dizzying library of mathematical overlays, it is easy to clutter your workspace until the actual price action disappears completely.
Four indicators stand out across modern financial markets: the Relative Strength Index (RSI), the Moving Average Convergence Divergence (MACD), the Exponential Moving Average (EMA), and the Volume Weighted Average Price (VWAP).
Whether you trade equities, cryptocurrencies, or foreign exchange, understanding what these tools measure—and what they ignore—is essential to building a clean, repeatable market research workflow. Let’s break down how each indicator works, compare their strengths, and explore how to assemble a balanced toolkit without falling into analysis paralysis.
The Core Four: What Each Indicator Actually Measures
No single indicator predicts the future. Instead, technical indicators take historical price and volume data, run it through a specific mathematical formula, and present the output visually. To choose the right tools, you must understand their underlying mechanics.
1. Relative Strength Index (RSI): Measuring Momentum
Developed by J. Welles Wilder Jr., the RSI is an oscillator that measures the speed and change of price movements on a scale of 0 to 100. It evaluates whether buyers or sellers have driven price rapidly in one direction over a chosen period (traditionally 14 bars).
- Overbought (>70): Suggests aggressive buying momentum that may be due for consolidation or exhaustion.
- Oversold (<30): Suggests strong downward pressure that may be stretching sellers thin.
- Centerline (50): Indicates a neutral balance between average gains and average losses.
Common Pitfall: A reading above 70 does not mean you should immediately sell or short an asset. In strong trends, RSI can remain in overbought territory for prolonged stretches while price continues climbing higher.
2. Moving Average Convergence Divergence (MACD): Tracking Trend Momentum
Created by Gerald Appel, the MACD reveals changes in the strength, direction, momentum, and duration of a trend. It consists of three primary components plotted around a zero line:
- The MACD Line: The difference between a short-term moving average (typically the 12-period EMA) and a longer-term moving average (the 26-period EMA).
- The Signal Line: An EMA of the MACD line itself (typically 9 periods).
- The Histogram: Visual bars showing the distance between the MACD Line and the Signal Line.
When the MACD line crosses above the signal line, upside momentum is accelerating. When it crosses below, downside momentum is taking control. Divergences—where price creates a higher high but the MACD creates a lower high—often flag weakening underlying momentum before a reversal occurs.
3. Exponential Moving Average (EMA): Following the Trend with Recency
Moving averages smooth out choppy price noise to help you identify the dominant trend direction. Unlike a Simple Moving Average (SMA), which weights all historical bars equally, an Exponential Moving Average places greater mathematical weight on the most recent price data.
- Faster response: EMAs react quicker to recent market events and price spikes than standard SMAs.
- Dynamic support & resistance: Traders frequently use key EMAs (such as the 9, 21, 50, and 200-period) to spot dynamic price reactions during established trends.
- Trend direction: When price remains consistently above a sloping EMA, the broader market bias leans bullish.
4. Volume Weighted Average Price (VWAP): The True Benchmark for Value
VWAP calculates the average price an asset has traded at throughout the day, weighted by cumulative volume. Because it incorporates volume alongside price, institutions and institutional algorithms use VWAP as a benchmark to measure execution efficiency.
- Intraday benchmark: VWAP resets at the start of every trading session (market open).
- Value reference: Trading above VWAP indicates that buyers are paying an above-average price relative to the day's volume, while trading below VWAP implies prices are below the volume-weighted average.
- Mean reversion: When price stretches too far away from the VWAP line, it often pulls back toward it to seek liquidity.
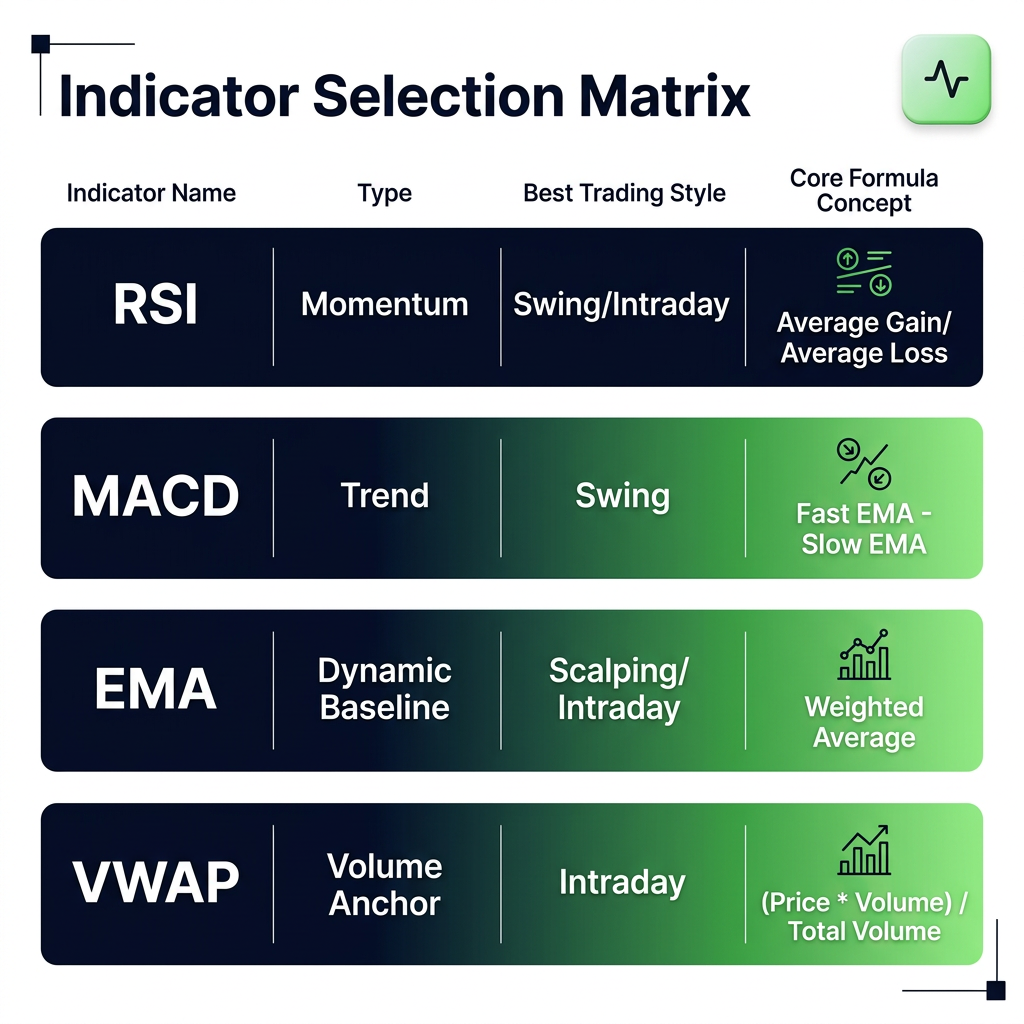
Comparing the Indicators: What Conditions Do They Suit?
Choosing the right indicator depends heavily on your timeframe and trading style. A day trader focusing on intraday market openings requires different inputs than a swing trader holding positions across multiple weeks.
For a detailed breakdown of core indicator mechanics and historical origins, resources like Investopedia's Technical Indicator Guide offer extensive historical background on technical math.
For a broader look at asset types and market mechanics across equities, forex, and digital assets, explore Trade AI Market Data.
The Danger of Indicator Overload (Analysis Paralysis)
A common mistake among retail traders is stacking multiple indicators that calculate the exact same underlying concept. Adding RSI, Stochastics, and Williams %R to the same chart does not provide three confirmations; it provides three slightly different views of the exact same momentum equation.
When your chart is crowded with duplicate indicators, you run into two problems:
- Lagging Confusion: By the time four or five lagging indicators agree, the move is often already finished.
- Conflicting Signals: One oscillator might read "overbought" while a moving average signals an active breakout, leaving you hesitant and unable to act.
The Rule of Three
A practical rule of thumb is to limit your chart setup to three distinct categories:
- One Trend Indicator: (e.g., 21 or 50 EMA) to tell you which direction the broader market is moving.
- One Momentum Indicator: (e.g., RSI or MACD) to gauge how fast price is moving and whether fuel remains in the move.
- One Volume or Value Benchmark: (e.g., VWAP or standard volume bars) to confirm whether substantial market participation backs the move.
Practical Indicator Setups for Retail Traders
How do these concepts look in real-world scenarios? Here are two widely used configurations tailored for individual market participants.
Setup A: The Intraday Day Trader (VWAP + 9 EMA + RSI)
- Context: Used on 2-minute to 15-minute charts for stocks or crypto.
- Execution: Check if price is holding above the intraday VWAP to confirm an overall bullish bias for the session. Watch for price to pull back toward the rising 9 EMA, verify that the RSI has reset toward 50 without collapsing, and monitor buyer reaction near the EMA/VWAP confluence.
Setup B: The Multi-Day Swing Trader (50 EMA + MACD)
- Context: Used on 4-hour or Daily charts.
- Execution: Identify assets trading above an upward-sloping 50 EMA to confirm a sustained multi-week trend. Wait for a temporary market pullback toward support, and look for the MACD Histogram to tick upward, confirming that selling pressure has decelerated.
Testing Your Strategy Before Risking Capital
Learning indicator theory is straightforward; executing it consistently during live market volatility takes practice. Instead of committing real capital immediately, test your indicator combinations in a risk-free environment.
With Trade AI Trading Simulation, retail traders can set up watchlists, practice interpreting indicator confluence, and test entry and exit mechanics using live market pricing without financial exposure.
If you prefer automated pattern assistance, Trade AI Chart Analysis allows you to analyze a symbol directly or upload a chart screenshot. The platform evaluates trend structures, key support and resistance zones, and chart formations, providing an objective second opinion to complement your manual technical reading.
For traders who prefer real-time alerts on the go, Trade AI Telegram Bot delivers market insights and signal alerts directly to your mobile device, allowing you to track setups as they develop.
Summary: Key Takeaways for Smarter Indicator Use
- Understand the Math: Know whether your indicator measures momentum (RSI), trend convergence (MACD), smoothed direction (EMA), or volume-weighted value (VWAP).
- Avoid Redundancy: Do not combine multiple indicators that perform the same function. Choose one per category (Trend, Momentum, Volume).
- Respect Market Context: Oscillators like RSI can stay overbought or oversold for extended periods during powerful trends.
- VWAP Is for Intraday: VWAP resets daily, making it best suited for day traders evaluating institutional benchmark levels.
- Validate First: Always practice your system using simulated portfolios before placing real trades.
Start Your Market Analysis
Ready to put these technical indicators into practice? Discover how automated insights can streamline your chart research.
Explore our tools, track multi-asset watchlists, and test your trading strategies with zero capital risk using the Trade AI platform.
Frequently Asked Questions (FAQ)
Can RSI and MACD be used together?
Yes. In fact, RSI and MACD complement each other well. While RSI measures the speed of price movement to identify overbought or oversold exhaustion points, MACD measures the relationship between two moving averages to evaluate trend momentum. Pairing them helps avoid entering trades when a trend is losing velocity.
Which indicator is best for scalping?
VWAP and short-period EMAs (such as the 9 and 21 EMA) are popular among scalpers. VWAP provides a dynamic benchmark for institutional volume throughout the day, while fast EMAs react rapidly to short-term price momentum on 1-minute and 5-minute charts.
Why does VWAP look different across daily and weekly charts?
Standard VWAP resets at the beginning of each trading day, calculating volume-weighted price solely for that active session. If viewed on daily or weekly charts, standard session VWAP is not applicable unless you use specialized "Anchored VWAP" tools anchored to a specific historical event or date.
How many indicators should I have on my chart?
Most experienced analysts recommend using no more than two or three indicators simultaneously. A clean setup generally includes one trend indicator (such as an EMA), one momentum oscillator (such as RSI or MACD), and a volume-based tool (such as VWAP or raw volume bars).
Is EMA better than SMA?
Neither is objectively "better"—they serve different purposes. The EMA reacts more quickly to recent price changes, making it useful for short-term and swing traders looking for early trend alerts. The Simple Moving Average (SMA) smooths out price equally, making it a favorite for long-term investors tracking major multi-month baselines like the 200-day SMA.
Disclaimer: Trade AI provides AI-generated market analysis, signals and insights for informational and educational purposes only. This content does not constitute financial, investment or trading advice, nor is it a recommendation to buy or sell any financial instrument. Markets are inherently unpredictable, and past or AI-generated analysis does not guarantee future results. Always conduct your own research and apply appropriate risk management before making any financial decision.
Frequently asked questions
- Can RSI and MACD be used together?
- Yes. RSI and MACD complement each other well. RSI measures the speed of price movement to identify overbought or oversold exhaustion points, while MACD measures the relationship between two moving averages to evaluate trend momentum.
- Which indicator is best for scalping?
- VWAP and short-period EMAs (such as the 9 and 21 EMA) are popular among scalpers. VWAP provides a dynamic benchmark for institutional volume throughout the day, while fast EMAs react rapidly to short-term price momentum on 1-minute and 5-minute charts.
- Why does VWAP look different across daily and weekly charts?
- Standard VWAP resets at the beginning of each trading day, calculating volume-weighted price solely for that active session. Standard session VWAP does not carry over onto multi-day or weekly candles unless an anchored calculation is applied.
- How many indicators should I have on my chart?
- Most experienced analysts recommend using no more than two or three indicators simultaneously: one trend tool (such as an EMA), one momentum oscillator (such as RSI or MACD), and one volume indicator (such as VWAP).
- Is EMA better than SMA?
- Neither is objectively better. The EMA reacts faster to recent price action, making it well-suited for short-term and swing trading. The SMA weights all periods equally, which creates a smoother, less sensitive baseline favored by long-term position traders.