How Trade AI as a Tool Can Help Traders Build Strategies

How Trade AI as a Tool Can Help Traders Build Strategies
Designing, backtesting, and deploying systematic trading strategies requires a balance between statistical rigor, robust infrastructure, and low-latency execution. Historically, quantitative analysts and algorithmic traders spent up to 80% of their engineering overhead building data ingestion pipelines, cleaning dirty tick feeds, and manually coding technical indicator libraries.
Modern quantitative workflows demand speed and scale without sacrificing mathematical precision. Trade AI's Trading Intelligence Platform provides the modular building blocks needed to automate strategy development. By unifying normalized historical and real-time market data, computer vision-based chart pattern recognition, and pre-computed technical indicators into a single developer interface, Trade AI helps traders transform hypothesis into execution rapidly.
Here is a technical exploration of how traders, quant developers, and fintech engineers leverage Trade AI as an infrastructure tool to build, validate, and automate high-performance trading strategies.
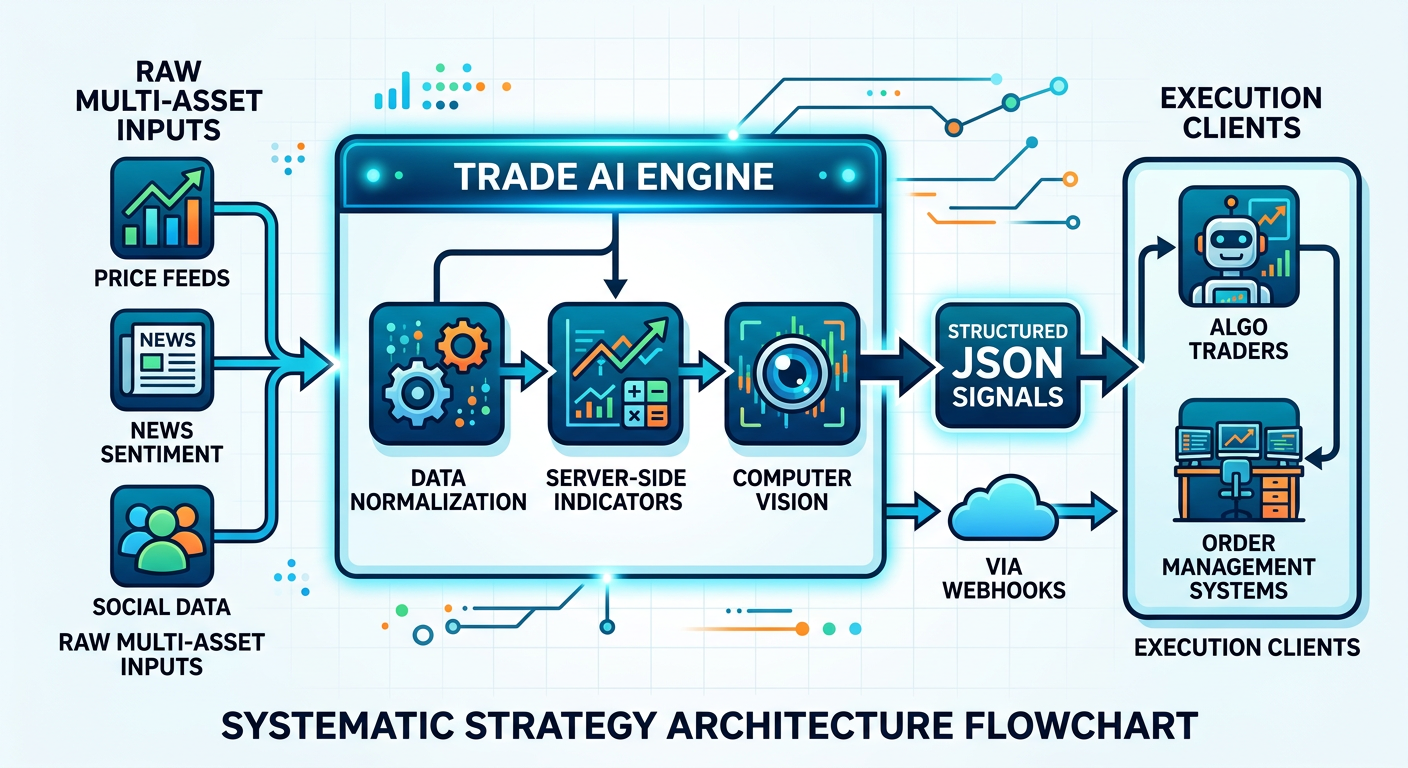
The Architecture of Systematic Strategy Development
A production-ready quantitative strategy relies on four discrete layers:
- Data Ingestion: Acquiring clean, normalized tick and OHLCV feeds across multiple asset classes.
- Feature Engineering: Computing indicators, oscillators, volume profiles, and structural chart patterns.
- Signal Generation: Evaluating market regimes, momentum thresholds, and probabilistic conditions.
- Execution & Risk Management: Dispatching orders, setting stop losses, and monitoring portfolio drawdowns.
Trade AI acts as the computational engine across the first three layers, delivering deterministic outputs that algorithmic systems can consume via REST endpoints, WebSocket streams, and webhooks.
1. Streamlining Data Acquisition with the Real-Time Market Data REST API
Strategy failure often traces back to underlying data defects: missing candles, misaligned timestamps across exchanges, or unadjusted corporate splits. Building custom scrapers or stitching together disparate exchange APIs introduces points of failure that degrade algorithmic performance.
Trade AI's real-time market data REST API normalizes multi-asset datasets across equities, foreign exchange, digital assets, and commodities. Instead of managing individual connections to multiple venues, developers query uniform endpoints that return sanitized OHLCV data with nanosecond precision.
By offloading API maintenance, connection pooling, and asset normalization, quant developers can focus their engineering resources on quantitative alpha research.
2. Offloading Compute with the OHLCV Technical Indicators API
Calculating sophisticated mathematical indicators—such as Exponential Moving Averages (EMA), Average True Range (ATR), Bollinger Bands, or Relative Strength Index (RSI)—locally in real time across hundreds of tickers is computationally expensive. It requires local memory allocations, historical caching, and continuous garbage collection.
Trade AI's OHLCV technical indicators API performs these calculations server-side. Traders can request pre-calculated mathematical arrays directly, bypassing the need to maintain localized calculation libraries inside lightweight microservices or edge functions.
- Deterministic Parity: Mathematical computations match between historical backtests and live forward tests, eliminating calculation drift.
- Lower Cloud Compute Costs: Microservices running on serverless environments require minimal CPU cycles since the math is pre-compiled.
- Reduced Latency: Edge-cached indicator endpoints deliver sub-millisecond responses for intraday trend identification.
3. Integrating Visual Intelligence with the Chart Pattern Recognition API
Traditional algorithmic strategies are mathematically sound but often blind to visual market geometry. Visual structures—such as trendline breaks, head-and-shoulders configurations, descending wedges, and fair value gaps—are difficult to code using pure price thresholds without generating high false-positive rates.
Trade AI bridges this divide using an AI chart pattern recognition API. Driven by proprietary computer vision models trained on millions of annotated financial charts, this capability converts raw visual setups into structured data objects.
Traders can upload an automated chart screenshot or pass a vector dataset, and Trade AI returns a structured JSON schema confirming pattern classification, confidence scores, invalidation coordinates, and target projections.
To see how computer vision models are integrated into daily scanning, explore our chart vision features.
4. Automating Strategy Execution with Crypto and Forex Signal Webhooks
Building a systematic trading strategy is only half the battle; distributing actionable signals to execution environments requires resilient communications infrastructure. Rather than continuously polling REST endpoints, developers use Trade AI's crypto and forex signal webhook architecture.
When a combined momentum-breakout condition triggers inside the Trade AI analytics engine, an HTTP POST payload is dispatched directly to your endpoint. Your receiver parses the JSON payload and automatically executes the order via MetaTrader 5, a broker API, or routes an alert to an automated Telegram bot.
5. Rapid Prototyping and Community Deployment
Strategy development is rarely confined to isolated execution terminals. Community managers, prop firm leaders, and fintech builders require interfaces that bridge institutional analytics to retail audiences.
- Telegram Trading Signal Bot: Broadcast automated alerts generated by your proprietary logic directly to subscriber channels without writing custom messaging middleware.
- Multi-Asset Portfolio Simulator: Test multi-asset rebalancing hypotheses, evaluate historical drawdowns, and analyze Sharpe ratios without risking capital.
- Chrome Extension for In-Browser Research: Summarize market news, macroeconomic releases, and technical reports directly within your research workflow.
Regulatory Disclaimer: The technical tools, APIs, and systems described in this article are intended strictly for educational, analytical, and software development purposes. Trade AI does not provide financial or investment advice. Historical performance, automated calculations, and pattern recognitions do not guarantee future market outcomes.
Frequently asked questions
- How does Trade AI eliminate the need for local technical analysis libraries?
- Trade AI calculates indicators such as EMA, RSI, MACD, and Bollinger Bands server-side across normalized OHLCV data. Developers query pre-computed endpoints directly, avoiding the need to compile TA-Lib or manage complex local memory allocations.
- What formats does the AI Chart Vision API support for pattern recognition?
- The AI Chart Vision API accepts standard image payloads (PNG, JPEG) via direct upload or base64 encoding, as well as raw coordinate/vector arrays. It outputs normalized JSON objects detailing pattern classifications, bounding areas, invalidation levels, and confidence scores.
- Can I connect Trade AI webhooks to automated execution platforms like MetaTrader 5?
- Yes. Trade AI sends deterministic JSON payloads via HTTP POST webhooks. You can ingest these using a lightweight bridge server (e.g., Python Flask/FastAPI or n8n) and forward orders directly to MT5, cTrader, or exchange REST endpoints.
- Which asset classes are supported by the Real-Time Market Data API?
- Trade AI provides normalized market data and technical indicator computations across equities, foreign exchange (FX), digital assets/cryptocurrencies, and major commodities.