How to Read Market Sentiment: A Beginner’s Guide to Bullish, Bearish & Neutral Signals
How to Read Market Sentiment: A Beginner’s Guide to Bullish, Bearish & Neutral Signals
Have you ever seen an asset release stellar earnings, only for its price to plummet moments later? Or perhaps you have watched a cryptocurrency rally aggressively despite a stream of cautious headlines. Scenarios like these often leave newer traders scratching their heads.
The missing piece of the puzzle is usually market sentiment.
While fundamental metrics outline what an asset should be worth, and technical indicators chart historical price movements, market sentiment reveals how traders collectively feel right now. In financial markets, emotion—predominantly fear, greed, and indifference—often dictates short-term price swings.
Understanding how to read market sentiment helps retail traders contextualize chart patterns, evaluate risk more objectively, and avoid emotionally driven market traps. In this beginner-friendly guide, we will break down what market sentiment is, how to identify bullish, bearish, and neutral signals, and how modern tools like Trade AI make sentiment analysis approachable for everyday traders.
1. What Is Market Sentiment and Why Does It Matter?
At its core, market sentiment represents the overall attitude, psychology, and emotional disposition of investors toward a specific asset, sector, or broader financial market. It reflects collective crowd psychology—a combination of hopes, expectations, biases, and anxieties.
The Psychology Behind Market Cycles
Markets do not operate in a vacuum; they are powered by human participants (and the algorithms programmed by them). When sentiment is overwhelmingly optimistic, market participants tend to overlook negative data and chase prices upward. Conversely, during periods of widespread panic or pessimism, traders frequently liquidate holdings regardless of underlying valuations.
Recognizing sentiment allows you to answer a critical trading question: Is the prevailing crowd buying out of excitement, dumping out of fear, or waiting patiently on the sidelines?
Sentiment as a Timing and Risk Management Filter
Tracking sentiment is not about attempting to predict the exact top or bottom of a price move. Instead, it serves as a risk management filter. For instance, entering a long position when sentiment has already reached historic euphoric extremes exposes you to heightened downside risk if an abrupt reversal occurs. Assessing sentiment helps ensure that your trades align with realistic crowd conditions rather than fleeting hype.
2. Decoding the Core Moods: Bullish, Bearish, and Neutral
Market conditions generally oscillate across three psychological regimes: bullish, bearish, and neutral. Learning to recognize the subtle nuances of each regime is fundamental to building a grounded market perspective.
Bullish Sentiment: Optimism, Momentum, and Dip-Buying
Bullish sentiment occurs when market participants anticipate rising prices. Characteristics of a bullish market environment include:
- Price Resilience: Bad news is rapidly absorbed or brushed aside, while positive news triggers aggressive buying rallies.
- Dip-Buying Behavior: Minor price pullbacks are swiftly met with buying demand as traders jump in to capitalize on perceived discounts.
- Expanding Volume on Rallies: Volume noticeably swells when prices push upward, reflecting genuine participation.
Bearish Sentiment: Fear, Caution, and Selling Rallies
Bearish sentiment reflects widespread worry, pessimism, and capital preservation. Key signals include:
- Sensitivity to Negative Catalysts: Even mildly disappointing economic data or headlines can prompt disproportionate selling.
- Faded Rallies: Brief upward price bounces are quickly met with supply as trapped traders seek an exit.
- Persistent Lower Highs: Price struggles to clear previous resistance points as caution dominates the trading floor.
Neutral Sentiment: Indecision and Consolidation
Markets spend significant time moving sideways rather than trending. Neutral sentiment is characterized by:
- Lack of Directional Conviction: Prices stay confined within a clear horizontal range between defined support and resistance.
- Compressing Volatility and Lower Volume: Participation often dries up as traders wait for decisive breakout catalysts.
- Mixed News Reaction: Positive and negative headlines counterbalance one another without setting off a dominant price trend.
3. Key Indicators and Methods Used to Gauge Sentiment
Seasoned market participants do not guess how the market feels; they look at verifiable indicators. You can read broader educational explanations on sentiment measures over at Investopedia.
Price Action and Technical Overextension
Technical indicators frequently shed light on extreme sentiment. For example, the Relative Strength Index (RSI) measures the velocity and magnitude of price moves. An RSI reading sustained well above 70 often indicates euphoric buying pressure, while a reading beneath 30 reflects sustained, pessimistic selling.
Similarly, moving averages illustrate whether buyers or sellers maintain medium-term structural control.
Volatility Gauges
Measures like the Cboe Volatility Index (VIX) for equity markets indicate the market's expectation of 30-day volatility. High volatility readings typically correspond with elevated fear and uncertainty, whereas low volatility often reflects calm—and occasionally complacent—market sentiment.
News Flow and Headline Tone
The tone of financial headlines is one of the most immediate reflections of market mood. When media outlets uniformly proclaim an unstoppable boom or an imminent collapse, crowd psychology is usually sitting at an emotional extreme.
4. How AI Simplifies Sentiment Analysis for Retail Traders
Historically, monitoring market sentiment across global equities, forex, commodities, and digital assets required hours of manual research—scouring financial news, reading analyst notes, and continuously checking charts. Today, smart intelligence platforms simplify this workflow.
Automated News Sentiment & Asset Impact
Through Trade AI's News & Market Sentiment feature, individual users can monitor live news flow without reading hundreds of articles manually. Trade AI analyzes incoming market headlines and data feeds, translating broad market narratives into straightforward sentiment summaries and asset-impact insights. This allows you to evaluate whether overall media coverage surrounding an asset leans bullish, bearish, or neutral in seconds.
Pairing Sentiment with AI Chart Analysis and Signals
Sentiment is most effective when evaluated alongside price structure. Trade AI allows retail traders to:
- Run AI Chart Analysis: Upload a chart screenshot or enter a symbol to receive automated identification of key support/resistance zones, trend biases, and classic candlestick patterns.
- Review AI Trading Signals: Evaluate AI-generated signals across stocks, crypto, forex, and commodities. Each signal outlines the directional bias, potential entry levels, stop-loss zones, and take-profit targets, backed by supporting rationale.
- Use the Telegram Bot: Prefer researching on the go? You can prompt Trade AI's personal Telegram bot directly from your mobile device to receive quick sentiment updates and chart observations.
Safe Experimentation in a Trading Simulator
Rather than risking real capital based on early sentiment reads, retail users can test ideas inside Trade AI's built-in Trading Simulation. You can practice identifying bullish breakouts or neutral consolidations and execute simulated buy and sell orders in real-time market conditions without financial risk.
5. Three Common Sentiment Traps Beginners Should Avoid
While sentiment analysis is a powerful analytical tool, misinterpreting it can lead to frustrating mistakes. Keep these three practical rules in mind:
1. Avoid Confusing Sentiment with Directional Certainty
Sentiment highlights market mood; it does not guarantee future price action. A heavily bearish market can experience sharp, sudden short squeezes, while an exuberant bullish market can crash abruptly. Never treat a sentiment score as a definitive roadmap.
2. Beware the Echo Chamber (FOMO)
Social media forums and specialized trading groups often turn into echo chambers that amplify greed and fear. Relying exclusively on social chatter often leads to "Fear Of Missing Out" (FOMO) near cycle peaks. Use independent, objective platforms like Trade AI to ground your research in data rather than crowd emotion.
3. Don't Trade Sentiment in Isolation
Always seek confirmation. If sentiment reports an aggressive bullish bias, check the chart: Is price currently struggling at major resistance? Is volume confirming the move? Combining sentiment indicators with sound technical levels creates a much more balanced market view.
Key Takeaways
- Sentiment is Collective Psychology: It mirrors the prevailing balance of fear, greed, and indifference among market participants.
- Three Primary Moods: Bullish markets absorb bad news and buy dips; bearish markets sell rallies; neutral markets stay confined to ranges.
- Combine Perspectives: Never trade sentiment on its own. Validate emotional conditions with technical price action, support/resistance levels, and volume.
- Utilize Smart Analytics: AI tools like Trade AI streamline research by automatically evaluating news sentiment, generating educational signals, and analyzing chart patterns.
- Practice First: Test your sentiment-reading skills inside a simulated environment before deploying real capital.
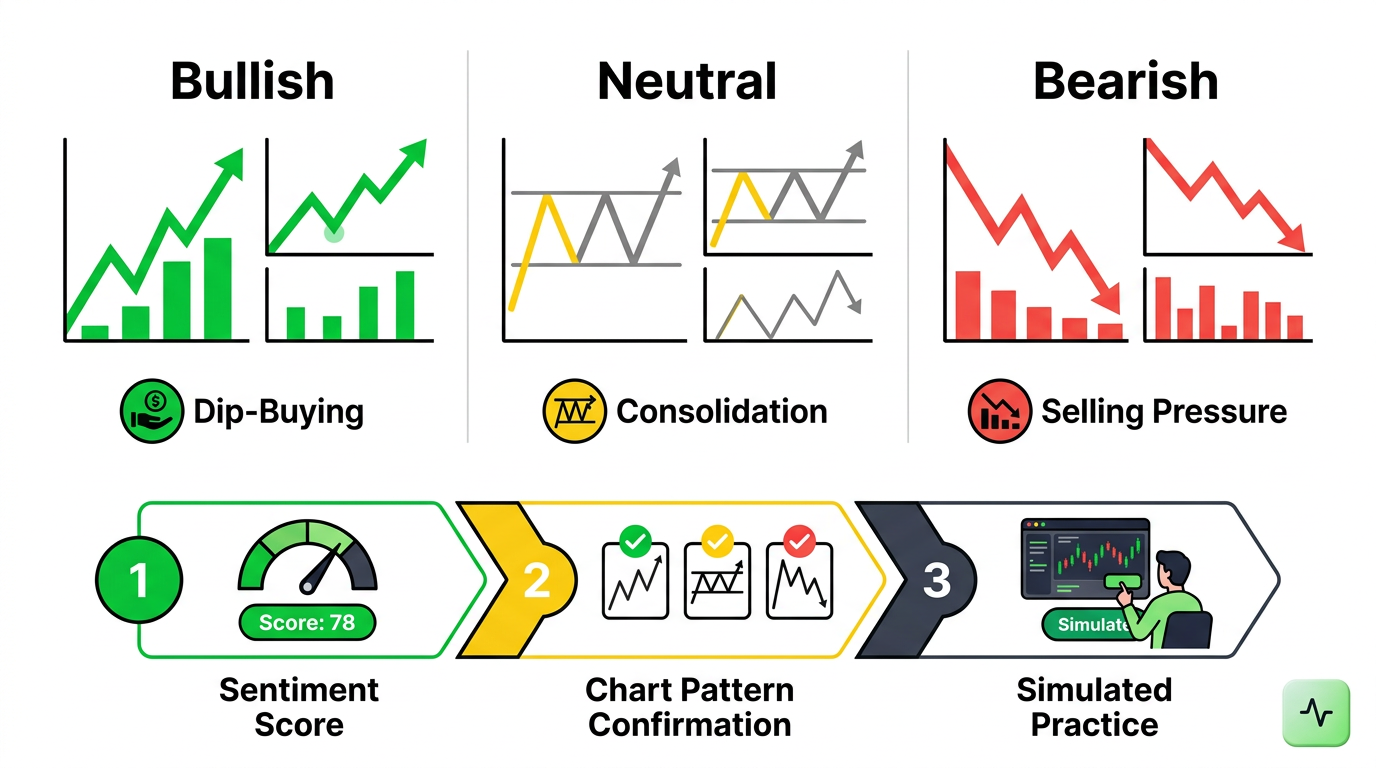
Infographic: The Beginner's Guide to Market Sentiment
Visual Summary: Understanding market mood requires assessing the three primary phases (Bullish: dip-buying and optimism; Bearish: faded rallies and fear; Neutral: consolidation and patience) and applying a disciplined 3-step workflow (Gauge News Mood → Confirm with Chart Vision → Practice in Simulation).
Ready to Level Up Your Market Analysis?
Navigating market sentiment does not have to feel overwhelming. Trade AI brings together market data, automated news sentiment, AI chart pattern detection, and risk-free trading simulations in one cohesive platform.
Whether you are scanning forex pairs, tracking crypto momentum, or following your favorite equities, Trade AI equips you with the educational tools you need to make informed, disciplined observations.
Start Your Market Analysis with Trade AI Today
Frequently Asked Questions (FAQ)
- Can market sentiment predict price movements with certainty?
No. Sentiment analysis identifies the prevailing psychological state of the market, but markets remain inherently unpredictable. Extreme sentiment can persist for extended periods, and unexpected macroeconomic events can change the market mood instantly. Always practice sound risk management. - What is the difference between technical analysis and sentiment analysis?
Technical analysis studies historical price action, patterns, and mathematical indicators on a price chart. Sentiment analysis assesses how market participants feel about an asset through news tone, surveys, volatility metrics, and crowd positioning. Combining both provides a more complete view. - How does Trade AI score news sentiment?
Trade AI uses artificial intelligence models to process incoming financial news articles and headlines. The system evaluates the context and tone of the reporting, assigning sentiment classifications (such as bullish, bearish, or neutral) and providing practical observations regarding potential asset impact. - Is Trade AI suitable for absolute beginners?
Yes. Trade AI is designed specifically to help retail traders research, analyze, and learn about financial markets across stocks, crypto, forex, and commodities. With tools like watchlists, automated chart vision, educational AI signals, and simulated paper trading, beginners can explore the markets at their own pace.
Disclaimer: Trade AI provides AI-generated market analysis, signals and insights for informational and educational purposes only. This content does not constitute financial, investment or trading advice, nor is it a recommendation to buy or sell any financial instrument. Markets are inherently unpredictable, and past or AI-generated analysis does not guarantee future results. Always conduct your own research and apply appropriate risk management before making any financial decision.
Frequently asked questions
- Can market sentiment predict price movements with certainty?
- No. Sentiment analysis identifies the prevailing psychological state of the market, but markets remain inherently unpredictable. Extreme sentiment can persist for extended periods, and unexpected macroeconomic events can change the market mood instantly. Always practice sound risk management.
- What is the difference between technical analysis and sentiment analysis?
- Technical analysis studies historical price action, patterns, and mathematical indicators on a price chart. Sentiment analysis assesses how market participants feel about an asset through news tone, surveys, volatility metrics, and crowd positioning. Combining both provides a more complete view.
- How does Trade AI score news sentiment?
- Trade AI uses artificial intelligence models to process incoming financial news articles and headlines. The system evaluates the context and tone of the reporting, assigning sentiment classifications (such as bullish, bearish, or neutral) and providing practical observations regarding potential asset impact.
- Is Trade AI suitable for absolute beginners?
- Yes. Trade AI is designed specifically to help retail traders research, analyze, and learn about financial markets across stocks, crypto, forex, and commodities. With tools like watchlists, automated chart vision, educational AI signals, and simulated paper trading, beginners can explore the markets at their own pace.