How to Identify Support and Resistance Levels on a Trading Chart

How to Identify Support and Resistance Levels on a Trading Chart
Every trader remembers the first time they opened a live candlestick chart. The dizzying flurry of green and red bars moving up and down can feel like pure chaos. Yet beneath those rapid price fluctuations lies a structured battle between buyers and sellers.
To make sense of that battle, market participants rely on one of the most foundational concepts in technical analysis: support and resistance.
Whether you trade equities, forex, commodities, or cryptocurrency, knowing how to spot these key price levels helps you understand where the market has historically paused, reversed, or accelerated. Rather than guessing where prices might head next, learning to map these levels gives your chart reading clear structural context.
In this step-by-step guide, we will break down what price zones really are, how to draw them accurately, how to trade breakouts and retests, and how modern tools like Trade AI can assist your chart studies.
1. What Are Support and Resistance Levels?
At its core, the concept reflects basic supply and demand:
- Support is a price level or area where buying interest is strong enough to overcome selling pressure. Think of it as a temporary "floor" preventing prices from declining further.
- Resistance is a price area where selling interest overcomes buying pressure, creating an overhead "ceiling" that stops prices from climbing.
Beginners often make the mistake of viewing support and resistance as razor-thin, exact lines—expecting an asset to bounce off precisely $150.00 down to the penny. In real markets, institutional orders, market liquidity, and volatility create slippage and varying touchpoints. For deeper foundational reading on these dynamics, explore the Investopedia guide to support and resistance basics.
Because of this, it is far more practical to treat support and resistance as horizontal zones or bands rather than rigid lines. Viewing them as zones prevents you from being shaken out by minor wick fluctuations.
2. Step-by-Step: How to Map Support and Resistance Zones
Mapping clean price zones requires patience and an objective routine. Follow this four-step process on any asset you analyze:
Step 1: Start on a Higher Timeframe
Always begin your analysis on a higher timeframe than the one you plan to trade. If you trade on the 15-minute or 1-hour chart, start by charting the daily or 4-hour chart. Higher timeframe levels carry more historical volume and market significance, making them far more reliable than micro-swings on 1-minute or 5-minute charts.
Step 2: Locate Significant Swing Highs and Swing Lows
Look back across recent price history and find major turning points (swing points). Where did the market make an aggressive rally and suddenly reverse downward? That peak represents a candidate for a resistance zone. Where did a sharp drop stop cold and reverse upward? That trough represents potential support.
Step 3: Draw Zones Across Multiple Touches
Connect multiple swing highs or lows using a shaded box or rectangle tool. Look for areas that have at least two—and ideally three or more—rejections over time. When drawing your zone:
- Cover both the extreme wick highs/lows and the cluster of candle opens and closes.
- Avoid drawing too many lines. A cluttered chart leads to analysis paralysis. Keep only the most prominent, obvious zones visible.
Step 4: Refine on Your Trading Timeframe
Once your primary higher-timeframe boundaries are plotted, switch to your execution timeframe. You can now see how immediate price action behaves as it approaches those major macro levels.
3. Breakouts vs. False Breakouts: How to Tell the Difference
Price cannot stay trapped between horizontal boundaries forever. Eventually, aggressive buying or selling pressure overwhelms the zone, causing a breakout.
However, one of the most frustrating experiences for retail traders is buying a breakout, only to watch price instantly plunge back into the range. This scenario is known as a false breakout or "liquidity sweep."
Here is how to evaluate the quality of a breakout:
- Candle Body Closes: A wick piercing through resistance does not constitute a confirmed breakout. Look for strong, decisive candle bodies closing completely outside the boundary zone.
- Volume Confirmation: Genuine breakouts are typically accompanied by an expansion in trading volume, indicating that institutions and aggressive market participants are committing capital to the move.
- Market Momentum: If price gradually drifts through a level on anemic volume, the likelihood of a fakeout increases significantly. Compare this to strong, energetic displacement candles, which signal real intent.
4. The Retest: When Resistance Becomes Support
One of the most elegant principles in technical analysis is polarity reversal: once a resistance level is broken, it frequently flips to become a new support level. Conversely, broken support often turns into future overhead resistance.
Why does this happen? Market psychology.
Imagine traders who shorted an asset at resistance. If price breaks upward violently, those short-sellers are trapped in losing positions. When price pulls back to the original breakout level (the "retest"), those traders rush to buy back their positions to break even, while sidelined breakout traders step in to add long positions. This wave of buying turns the previous ceiling into a solid floor.
A Patient Approach to Retests
- Do not chase the initial candle: Chasing an extended breakout candle exposes you to poor risk-to-reward ratios.
- Wait for the pullback: Allow price to retrace back toward the broken boundary zone.
- Look for confirmation candles: Look for rejection candles (such as pin bars, hammers, or bullish engulfing candles) bouncing off the newly formed support level before formulating your trade thesis.
5. Elevating Your Chart Work with Trade AI
While drawing zones manually is an essential skill, confirming your structural chart reads with modern technology can save time and reduce subjective bias. This is where Trade AI chart analysis fits naturally into your routine.
With Trade AI, individual retail traders can:
- Analyze Chart Screenshots Instantly: Simply upload a screenshot of your chart or enter a ticker symbol into Trade AI. The platform's AI chart analysis scans the structure to highlight key patterns, trends, and support/resistance zones.
- Validate Your Own Zones: Use Trade AI's objective readings as a second pair of eyes to see if an algorithmic model identifies the same structural swing points you spotted manually.
- Practice with Zero Capital Risk: Not sure whether a breakout will hold? Instead of putting live capital on the line, test your entry and exit ideas inside Trade AI's trading simulation environment. You can execute simulated trades against live market feeds to measure your hit rate over dozens of retests.
- Stay Notified on the Go: Trade AI's connected Telegram bot allows you to request instant market insights and monitor key asset setups without remaining glued to multiple screens.
By pairing solid technical fundamentals with automated analysis, you can build a more structured, confident approach to reading markets.
Summary / Key Takeaways
- Think in zones, not lines: Treat support and resistance as dynamic price bands rather than exact numbers to account for natural market volatility.
- Prioritize higher timeframes: Daily and 4-hour levels carry significantly more reliability than lower timeframe noise.
- Beware of false breakouts: Always look for full candle closes beyond the level and verify the move with market volume.
- Embrace the retest: Polarity reversal—where old resistance becomes new support—often presents more favorable risk-reward setups than chasing raw breakout spikes.
- Combine tools with practice: Use platforms like Trade AI to double-check structural levels and validate your strategies in simulated environments before risking capital.
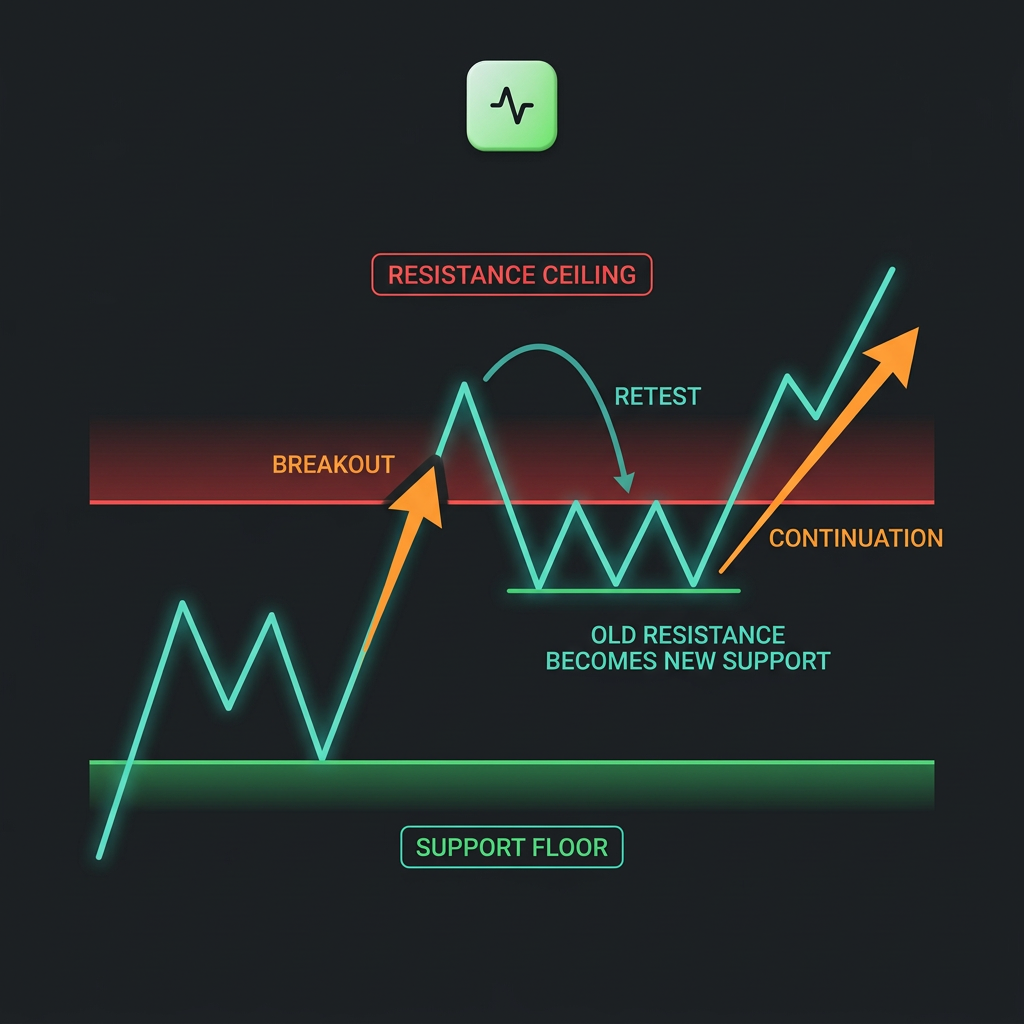
Visual Summary: Navigating Support, Breakouts, and Retests
Support & Resistance Lifecycle
1. Range Consolidation: Price bounces between Support (Floor) and Resistance (Ceiling).
2. The Breakout: Price pushes aggressively through Resistance on high volume with a strong candle close.
3. The Retest: Price pulls back to test the old Resistance line.
4. Role Reversal: The previous ceiling holds as new Support, validating upward continuation.
Ready to Master Your Chart Analysis?
Sharpening your eye for market structure is one of the most rewarding investments you can make in your trading education. Rather than analyzing charts in isolation, equip yourself with intelligent tools that clarify the big picture.
Explore Trade AI today to upload your charts, discover automated technical insights, and test your support and resistance strategies inside a realistic trading simulator.
Frequently Asked Questions (FAQ)
How many times must a level be touched to be considered valid?
Generally, a price zone requires at least two swing rejections to be considered a viable level. A third touch that respects the boundary strongly confirms that other market participants are watching and reacting to that zone.
Should I draw support and resistance from candle wicks or bodies?
It is best practice to include both. Use the candle bodies (where the majority of trading volume settled) to define the core of the zone, and use the outer wick extremes to define the outer boundary. This creates a realistic price zone rather than an artificial line.
Why do support and resistance levels eventually break?
Levels break because the balance of supply and demand shifts. Every time a price level is tested, the limit orders sitting at that level are filled. If a level is tested repeatedly in a short period without a strong bounce, those orders can become exhausted, paving the way for a decisive breakout.
Can Trade AI automatically mark support and resistance for me?
Yes. With Trade AI’s AI Chart Analysis feature, you can input a supported symbol or upload a chart screenshot. The platform analyzes the chart data to identify prominent support/resistance zones, active trends, and recognizable price patterns for educational review.
Disclaimer: Trade AI provides AI-generated market analysis, signals and insights for informational and educational purposes only. This content does not constitute financial, investment or trading advice, nor is it a recommendation to buy or sell any financial instrument. Markets are inherently unpredictable, and past or AI-generated analysis does not guarantee future results. Always conduct your own research and apply appropriate risk management before making any financial decision.
Frequently asked questions
- How many times must a level be touched to be considered valid?
- Generally, a price zone requires at least two swing rejections to be considered a viable level. A third touch that respects the boundary strongly confirms that other market participants are watching and reacting to that zone.
- Should I draw support and resistance from candle wicks or bodies?
- It is best practice to include both. Use the candle bodies (where the majority of trading volume settled) to define the core of the zone, and use the outer wick extremes to define the outer boundary. This creates a realistic price zone rather than an artificial line.
- Why do support and resistance levels eventually break?
- Levels break because the balance of supply and demand shifts. Every time a price level is tested, the limit orders sitting at that level are filled. If a level is tested repeatedly in a short period without a strong bounce, those orders can become exhausted, paving the way for a decisive breakout.
- Can Trade AI automatically mark support and resistance for me?
- Yes. With Trade AI’s AI Chart Analysis feature, you can input a supported symbol or upload a chart screenshot. The platform analyzes the chart data to identify prominent support/resistance zones, active trends, and recognizable price patterns for educational review.