From Market Data to Trading Intelligence: How AI Turns Raw Data Into Insights
From Market Data to Trading Intelligence: How AI Turns Raw Data Into Insights
Every second, global financial markets generate millions of data points. Between fluctuating bid-ask spreads, candlestick prints across various timeframes, sudden volume spikes, breaking economic announcements, and social sentiment, retail traders face an overwhelming wall of noise.
Historically, interpreting this data required hours of manual screen time. You had to draw trendlines by hand, toggle between multiple terminal windows, scan dozens of news feeds, and cross-reference indicators to form a single market thesis. Even then, emotional biases and fatigue often skewed the outcome.
Today, artificial intelligence is reshaping how retail participants interact with financial markets. Instead of drowning in endless streams of raw numbers, traders can now leverage modern AI to filter noise, spot subtle visual formations, evaluate portfolio risk, and transform raw market data into clear trading intelligence.
Here is how that transformation happens—and how you can use it to build a structured, objective approach to market research.
The Retail Dilemma: Drowning in Raw Market Data
Raw market data is simply factual measurement: the price of an asset, the volume traded at a specific instant, and the open-high-low-close-volume (OHLCV) values of a session. While accurate, raw data is passive. It tells you what happened, but it offers zero context about what those events mean.
The Challenge of Cognitive Overload
Human attention is a finite resource. When you monitor multiple asset classes—such as equities, forex pairs, crypto tokens, and commodities—the sheer volume of information quickly causes cognitive overload. According to financial education resources like Investopedia, sound technical analysis requires consistent discipline, yet retail traders often succumb to "analysis paralysis" when indicators deliver conflicting signals.
Noise vs. Genuine Signal
Not every price movement is meaningful. A sudden 1% spike on thin volume during an off-hours session might look like a breakout on a 5-minute chart, but on a macro scale, it may just be liquidity clearing before a continuation lower. Sorting true structural market shifts from fleeting market noise is one of the hardest skills for any trader to master.
The Architecture of Intelligence: How AI Cleans and Synthesizes Data
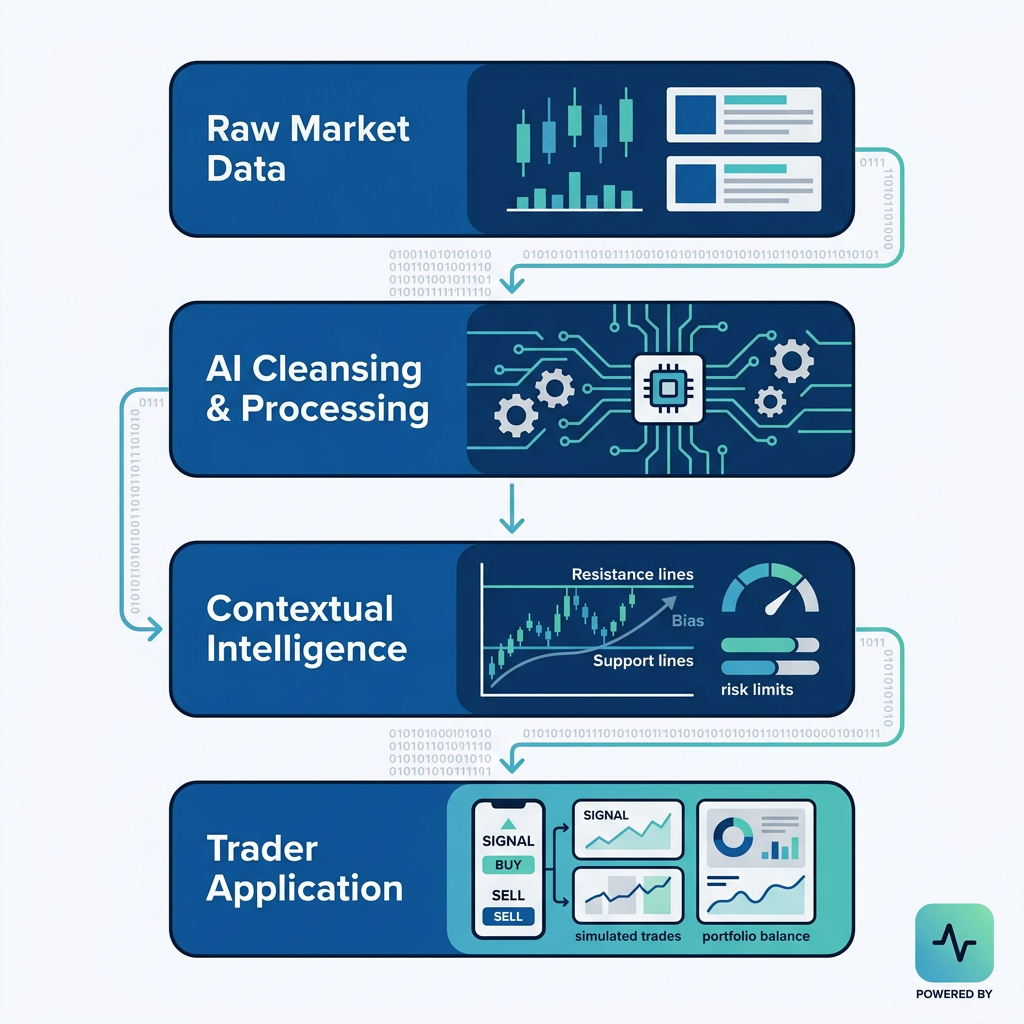
Transforming millions of disconnected figures into coherent market intelligence requires a systematic pipeline. AI does not rely on intuition or emotion; it processes data through structured layers.
1. Ingestion and Normalization
Before analysis begins, data from disparate asset classes must be cleaned and standardized. Whether examining a cryptocurrency pair, an index future, or a foreign exchange rate, the AI normalizes price increments, handles missing data points, and standardizes multi-timeframe structures into a unified analytical environment.
2. Multi-Dimensional Pattern Recognition
Traditional technical indicators (such as simple moving averages or basic RSI oscillators) evaluate only a single dimension of price over a fixed period. AI models, by contrast, evaluate multiple dimensions simultaneously: price action, momentum velocity, volume confirmation, and historical support/resistance reactions. By assessing these variables concurrently, the system spots confluence across conditions that a human eye might miss.
Seeing the Big Picture: AI Chart Vision and Pattern Analysis
One of the most practical breakthroughs for individual traders is computer vision applied to financial charts. For years, identifying chart patterns—such as head and shoulders, ascending triangles, or liquidity sweeps—was entirely subjective. Two traders looking at the exact same daily chart often drew completely different trendlines.
Automated Visual Assessment
With tools like AI Chart Analysis, traders no longer need to second-guess subjective chart drawings. You can either look up a symbol directly within the platform or upload a screenshot of your own chart. The AI examines the visual price structure, identifies key support and resistance zones, determines trend direction, and points out prevailing chart formations.
Contextualizing Technical Levels
Rather than offering a generic price target, AI chart analysis provides context. It explains why a level matters—for instance, noting that a price zone represents a multi-week resistance level with declining buying volume. This helps traders understand market mechanics rather than relying on blind guesswork.
From Analysis to Action: Structured Signals and Risk Parameters
Turning market intelligence into an actionable plan requires more than an opinion on direction; it requires defined risk parameters. An analysis that simply says "this stock looks bullish" is incomplete without an entry strategy, invalidation point, and logical exit targets.
The Anatomy of an AI Trading Signal
When modern platforms produce AI Trading Signals across equities, crypto, forex, or commodities, they synthesize technical structure and volatility into an actionable layout:
- Market Bias: A clear perspective on whether the prevailing momentum favors bulls or bears.
- Entry Zone: A calculated price level where reward-to-risk dynamics are mathematically favorable.
- Stop-Loss Level: An objective invalidation point. If price hits this level, the thesis is broken, limiting downside exposure.
- Take-Profit Targets: Tiered price levels aligned with historical resistance, liquidity pools, or Fibonacci extensions.
- Supporting Rationale: The underlying technical reasoning behind the setup, helping the trader learn the logic behind the signal.
EUR/USD Example Signal: Entry range 1.0820 - 1.0835 | Stop-loss: 1.0790 | Take-profit: 1.0880 / 1.0925 | Bias: Bullish Continuation based on confluence of 4-hour demand and momentum stabilization.
This structured format helps individual traders build discipline, preventing impulsive entries and emotional stop-loss adjustments.
Decoding Market Mood: AI News and Sentiment Analysis
Price action does not happen in a vacuum. Geopolitical developments, central bank interest rate decisions, and corporate earnings releases heavily influence market trajectory. However, reading hundreds of financial news releases daily is impossible for any individual.
Natural Language Processing in Finance
Modern Natural Language Processing (NLP) models read, categorize, and score financial news in seconds. Instead of scanning through pages of corporate filings, AI summarizes the central theme and assigns a sentiment rating—bullish, bearish, or neutral.
Assessing Potential Market Impact
Not all news carries equal weight. An earnings report beat of 1% during a bull market might have minimal impact, whereas unexpected regulatory news in crypto can trigger immediate volatility. AI sentiment tools evaluate news in relation to current market conditions, helping traders anticipate how the broader market may respond to breaking headlines.
Practicing Without Risk: Simulation and Portfolio Intelligence
Acquiring trading intelligence is only half the battle; knowing how to manage that intelligence within a balanced portfolio is what ensures long-term sustainability. Retail participants frequently struggle with over-concentration, taking on outsized risk in a single asset.
Objective Portfolio Insights
With AI Portfolio Insights, traders can evaluate their broader holdings across multiple asset classes. By importing positions via CSV, PDF statements, or manual entry, the platform reviews asset allocation, sector exposure, and potential concentration risks. It highlights imbalances—such as holding 70% of a portfolio in high-beta tech equities—allowing traders to make calculated adjustments.
The Power of Trading Simulation
Before committing capital to a new strategy or indicator pattern, testing the concept in real market conditions is vital. Through Trading Simulation, traders can execute simulated orders against live market prices. This risk-free environment lets you validate how AI-generated signals and personal strategies perform over time, building psychological confidence without risking personal funds.
Summary: Key Takeaways
- Data is Passive, Intelligence is Actionable: Raw market data shows past transactions, but AI contextualizes price action, volume, and momentum to uncover underlying trends.
- Eliminate Emotional Bias: Computer vision and automated pattern recognition evaluate chart structures objectively, removing personal sentiment from technical analysis.
- Structured Risk Matters Most: Quality AI signals provide clear entry zones, invalidation points (stop-losses), and profit targets alongside detailed educational rationale.
- Holistic Decision-Making: Combining technical chart analysis with news sentiment and portfolio tracking yields a well-rounded view of the market.
- Validate Before Risking Capital: Utilizing paper trading simulators allows traders to practice incorporating AI insights into their routines safely.
Start Your Market Analysis with Trade AI
Navigating modern financial markets doesn't require spending twelve hours a day glued to static charts. By using Trade AI, individual traders can streamline their research, analyze charts with computer vision, track sentiment, and practice strategies in a risk-free simulator.
Ready to transform how you view the markets? Explore Trade AI today and elevate your market research workflow.
Frequently Asked Questions (FAQ)
How does AI differ from traditional technical indicators?
Traditional technical indicators apply fixed mathematical formulas (like moving averages or standard deviations) to past price data. AI evaluates multiple data streams simultaneously—including price structure, volume confluence, and multi-timeframe trends—delivering holistic context rather than a single lagging metric.
Can AI guarantee profitable trades?
No. Financial markets are dynamic, complex systems influenced by unpredictable human behavior and global events. AI cannot predict market outcomes with certainty. Its purpose is to process data efficiently, highlight probabilistic setups, and support disciplined risk management.
Do I need coding or technical skills to use Trade AI?
Not at all. While institutional APIs exist for developers, Trade AI for individual retail users is designed as an intuitive, user-friendly platform. You can upload chart screenshots, browse market watchlists, review automated signals, and simulate trades through a clean graphical interface or directly via a personal Telegram bot.
What asset classes can AI analyze?
Modern AI platforms like Trade AI evaluate multiple major financial markets, including equities (stocks), foreign exchange (forex), commodities (such as gold and crude oil), and cryptocurrencies.
How does paper trading help when using AI signals?
Paper trading lets you simulate buys and sells against live market prices without risking real money. This allows you to evaluate how signals perform across different market regimes, test personal risk management rules, and build familiarity with platform features.
Disclaimer: Trade AI provides AI-generated market analysis, signals and insights for informational and educational purposes only. This content does not constitute financial, investment or trading advice, nor is it a recommendation to buy or sell any financial instrument. Markets are inherently unpredictable, and past or AI-generated analysis does not guarantee future results. Always conduct your own research and apply appropriate risk management before making any financial decision.
Frequently asked questions
- How does AI differ from traditional technical indicators?
- Traditional indicators compute simple mathematical formulas on past price data. AI analyzes multi-dimensional data across timeframes, chart patterns, volume, and sentiment simultaneously to provide holistic market context.
- Can AI guarantee profitable trades?
- No. Markets are inherently unpredictable, and AI cannot guarantee profits or predict the future with certainty. Trade AI provides educational analysis and risk parameters to help traders make more informed personal decisions.
- Do I need coding or developer skills to use Trade AI?
- No. Trade AI for individual users is completely visual and beginner-friendly, featuring chart uploads, intuitive watchlists, web dashboards, and an interactive Telegram bot.
- What asset classes does Trade AI support?
- Trade AI supports multi-market analysis across global equities (stocks), cryptocurrencies, foreign exchange (forex), and commodities.
- How does paper trading work with AI signals?
- The built-in trading simulation allows you to execute virtual buy and sell decisions against real-time market quotes, letting you practice strategies and test signal ideas without risking real capital.