EMA vs SMA: Understanding Moving Averages in Technical Analysis
EMA vs SMA: Understanding Moving Averages in Technical Analysis
Every trader has opened a price chart and felt overwhelmed by the jagged, erratic swings of candlesticks. Financial markets rarely move in straight lines; instead, they oscillate with constant intraday noise. To see the broader trend through the static, technical analysts rely on moving averages.
Among trend-following indicators, the debate almost always centers on EMA vs SMA—the Exponential Moving Average versus the Simple Moving Average. While both tools calculate average price over a specific timeframe to identify momentum and dynamic support or resistance, their behavior on a live chart is noticeably distinct.
In this guide, we break down how each average works, evaluate their responsiveness, examine high-probability crossover strategies, and highlight common beginner mistakes so you can choose the right indicator for your trading style.
What Are Moving Averages? (SMA Basics vs. EMA Mechanics)
A moving average smooths out historical price data by continually updating an average price over a designated period (such as 20, 50, or 200 bars). The difference between the two main variations lies entirely in how they distribute mathematical weight across that historical window.
Simple Moving Average (SMA): Equal Weight Across Time
The Simple Moving Average is the most intuitive calculation in technical analysis. To find a 10-day SMA, you add the closing prices of the last 10 days and divide that sum by 10. As each new day closes, the oldest day drops off the dataset, and the newest day takes its place.
Because every single day receives the exact same mathematical weight (10% of the total calculation in a 10-day period), an extreme price spike from nine days ago impacts the average just as heavily as price action that happened five minutes before the market closed today.
Exponential Moving Average (EMA): Prioritizing Recent Price Action
The Exponential Moving Average solves the equal-weight dilemma by applying a multiplier that weights recent price data more heavily than older bars. While older prices still influence the value, their impact decays exponentially over time.
Because of this weighting, an EMA reacts quickly when buyers or sellers step in aggressively. If an asset gaps higher on unexpected market sentiment, an EMA turns upward almost immediately, whereas an SMA takes several sessions to reflect the shift.
EMA vs SMA: Key Differences in Responsiveness and Lag
When evaluating EMA vs SMA, the central trade-off is responsiveness versus lag.
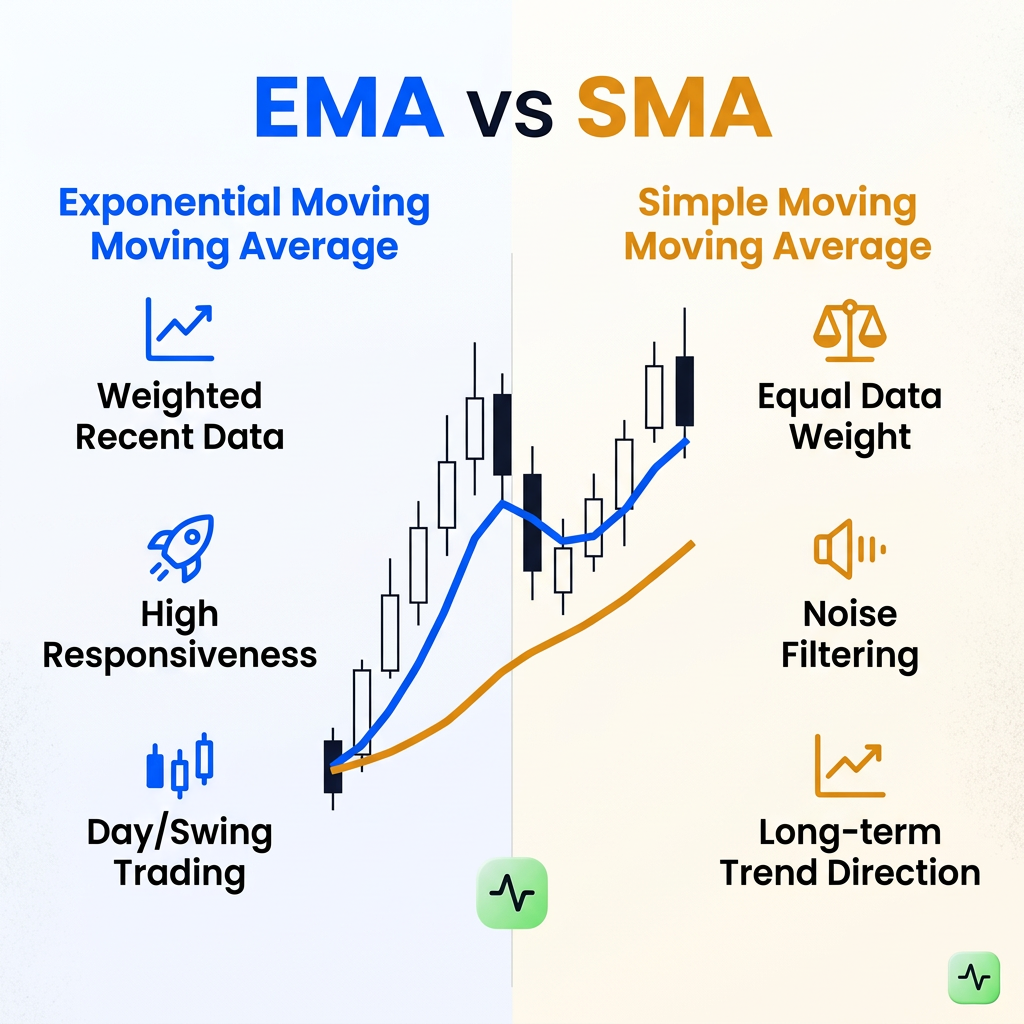
- Calculation Method: SMA applies equal weight to all periods; EMA applies exponential weight favoring the newest bars.
- Reaction Time: SMA is slower, filtering short-term spikes; EMA curves immediately toward fresh price action.
- Lag Factor: SMA trails price significantly; EMA hugs candlesticks tightly.
- False Signals: SMA produces fewer false breakouts in chop; EMA is vulnerable to whipsaws in sideways conditions.
- Best Suited For: SMA excels at macro trend tracking; EMA shines for short-term momentum and swing entries.
The Cost of Lag (SMA)
Because the SMA moves slowly, it acts as a reliable filter against market noise. When a stock dips intraday due to temporary panic, an SMA often stays flat or gently climbs, preventing you from exiting a healthy uptrend prematurely. However, that stability comes with a downside: by the time an SMA changes direction, a significant portion of the trend may have already elapsed.
The Risk of Whipsaws (EMA)
Conversely, the responsiveness of an EMA helps active traders spot early momentum shifts. If you trade volatile crypto or fast-moving forex pairs, waiting for an SMA can mean missing the ideal risk-to-reward window. But because the EMA hugs price so tightly, it frequently generates "whipsaws"—situations where the indicator turns or crosses over, only for price to abruptly reverse, triggering an unnecessary stop-loss.
Popular Moving Average Strategies and Crossover Signals
Traders rarely use moving averages in isolation. Instead, they pair different periods together to generate crossover signals or confirm broader market structure.
1. The Golden Cross and Death Cross
The most recognized long-term trend strategy relies on the 50-period and 200-period SMAs:
- Golden Cross: Occurs when the faster 50 SMA crosses above the slower 200 SMA, historically signaling the transition from a bear market to a structural bull trend.
- Death Cross: Occurs when the 50 SMA crosses below the 200 SMA, warning traders that long-term distribution is underway.
Because institutional investors closely monitor these levels, these crossover events frequently become self-fulfilling areas of liquidity.
2. The 9/21 EMA Momentum Crossover
For swing traders and intraday participants, the 9 EMA and 21 EMA combination is a staple. When the 9 EMA crosses cleanly above the 21 EMA during an uptrend, it signals that immediate buying pressure is accelerating. Traders often wait for price to pull back and touch the 21 EMA—using it as dynamic support—before entering in the direction of the cross.
3. Dynamic Support and Resistance
Moving averages don't just point up or down; they act as mobile floors and ceilings. During strong sustained rallies, institutional buyers frequently step in when an asset tests its 20-day EMA or 50-day SMA. Recognizing these dynamic zones allows you to place logical stop-losses below sloping trendlines rather than arbitrary price figures.
Common Moving Average Mistakes to Avoid
Even experienced retail traders can fall into common traps when applying moving averages to live charts:
- Trading Crossovers in Sideways Markets: Moving averages are trend-following indicators. In a ranging, consolidating market, moving averages flatten out and intertwine. Attempting to trade every cross in a range will result in repeated losses from false breakouts.
- Cluttering the Chart with Redundant Averages: Stacking a 10 EMA, 20 EMA, 50 EMA, 20 SMA, and 100 SMA on a single chart leads to analysis paralysis. Pick two or three complementary lengths with distinct purposes.
- Treating Lines as Exact Laser Levels: Moving averages represent zones, not rigid barriers. Price frequently wicks through an average before reversing. Give your setups room to breathe rather than assuming a single touch guarantees an immediate bounce.
Leveling Up Your Analysis with Trade AI
Understanding moving average theory is straightforward, but interpreting them consistently across multiple timeframes and market conditions requires practice.
This is where Trade AI helps bridge the gap for individual traders:
- AI Chart Analysis: Instead of second-guessing whether a moving average bounce is valid, you can upload a chart screenshot or analyze a symbol directly. Trade AI identifies underlying chart patterns, key support and resistance zones, and broader trend bias to provide educational context.
- Live Market Data and Watchlists: Track stocks, crypto, commodities, and forex with real-time indicators through centralized market data watchlists. See at a glance which assets are holding above their 50 or 200-period averages.
- Trading Simulation: Unsure whether a 9/21 EMA crossover works better on your favorite assets than a classic 20/50 SMA system? Use Trade AI's paper trading simulator to test your setups against live market pricing without risking real capital.
- AI News & Sentiment Integration: Moving average crossovers often fail when unexpected macro news breaks. Trade AI pairs price metrics with automated news sentiment scoring, helping you spot when fundamentals might override technical indicators.
Summary & Key Takeaways
- EMA prioritizes recent data: Uses an exponential weighting mechanism that reacts quickly to short-term momentum, making it ideal for day and swing traders.
- SMA provides smooth macro context: Applies equal weight to all historical periods, effectively filtering out noise and defining long-term institutional levels.
- Lag vs. Whipsaws: The primary dilemma in EMA vs SMA is accepting lag (SMA) to avoid false breakouts, or gaining speed (EMA) at the risk of choppy whipsaws.
- Context is king: Moving averages shine in trending environments but produce false signals during sideways consolidation. Always confirm setups with broader volume, market structure, or multi-asset sentiment.
- Practice before execution: Test your moving average strategies using risk-free market simulators and automated chart reviews before allocating capital.
Start Your Market Analysis
Ready to bring clarity to your charts? Whether you are testing your first moving average crossover strategy or refining a multi-asset watchlist, Trade AI puts automated technical insights, paper trading simulation, and market data at your fingertips.
Try Trade AI for Free and elevate your chart research today.
Frequently Asked Questions (FAQ)
Which is better for day trading: EMA or SMA?
Most day traders prefer the Exponential Moving Average (EMA). Because intraday trading requires swift decision-making, the EMA's sensitivity to recent price shifts allows day traders to identify momentum bursts and enter pullbacks with tighter stop-losses than a slower SMA would permit.
Can you combine an EMA and an SMA on the same chart?
Yes. Many professional traders use an EMA (such as the 20 EMA) to monitor short-term momentum and pullbacks, while keeping a 200-day SMA on the chart to maintain perspective on the broader institutional trend. Combining both avoids redundancy while providing multi-timeframe context.
Why do moving average crossovers fail during consolidations?
Moving averages are inherently trend-following tools that rely on sustained price displacement. In a sideways or consolidating market, price oscillates repeatedly around a mean. This causes fast and slow averages to cross back and forth repeatedly without directional follow-through, resulting in whipsaws.
What are the most popular moving average settings?
The most common settings are the 9, 20, and 21 periods for short-term EMA momentum, and the 50, 100, and 200 periods for medium- and long-term SMA trend identification. These periods are widely watched across global financial markets, often reinforcing their technical reliability.
Disclaimer: Trade AI provides AI-generated market analysis, signals and insights for informational and educational purposes only. This content does not constitute financial, investment or trading advice, nor is it a recommendation to buy or sell any financial instrument. Markets are inherently unpredictable, and past or AI-generated analysis does not guarantee future results. Always conduct your own research and apply appropriate risk management before making any financial decision.
Frequently asked questions
- Which is better for day trading: EMA or SMA?
- Most day traders prefer the Exponential Moving Average (EMA). Because intraday trading requires swift decision-making, the EMA's sensitivity to recent price shifts allows traders to spot momentum bursts and manage tight stop-losses more effectively than a lagging SMA.
- Can you combine an EMA and an SMA on the same chart?
- Yes. Traders often plot a fast EMA (such as the 20 EMA) to monitor immediate momentum and pullbacks, alongside a 200-day SMA to track macro institutional support and overall trend direction.
- Why do moving average crossovers fail during consolidations?
- Moving averages are trend-following indicators. During sideways or range-bound markets, prices fluctuate around a central price without conviction, causing moving averages to crisscross repeatedly and generate false 'whipsaw' breakout signals.
- What are the most popular moving average settings?
- Popular settings include the 9, 20, and 21 periods for short-term EMA momentum, and the 50, 100, and 200 periods for medium- to long-term SMA macro trend identification.