Candlestick Patterns Explained: A Practical Guide to Reading Price Action
Candlestick Patterns Explained: A Practical Guide to Reading Price Action
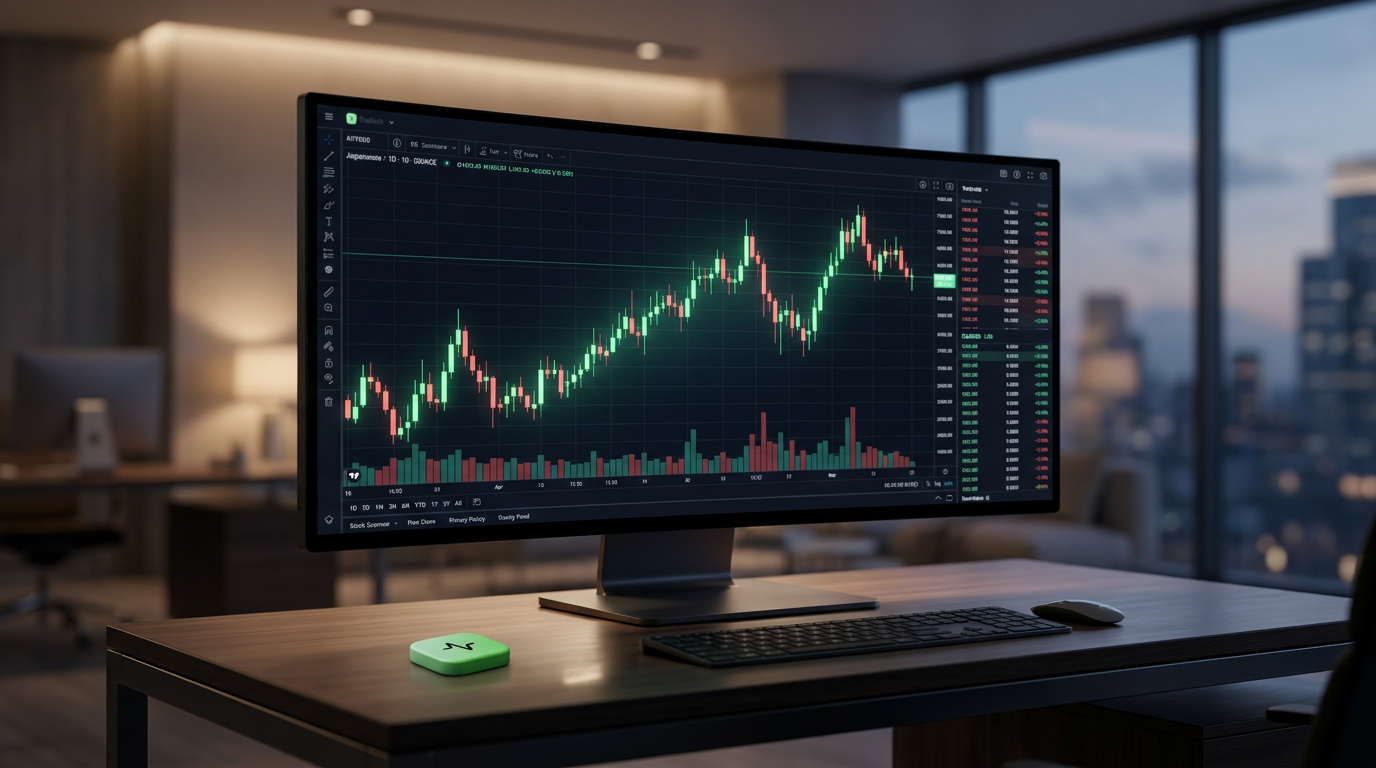
Financial charts can often look like an overwhelming sea of red and green bars, particularly if you are just beginning your trading journey. However, behind those fluctuating bars lies a vivid story of market psychology: a real-time tug-of-war between buyers seeking higher prices and sellers pushing for discounts.
At the center of visual market analysis are candlestick patterns. Originating in 18th-century Japan to track rice contracts, Japanese candlesticks remain one of the most versatile and intuitive tools available to retail traders across equities, forex, commodities, and crypto.
In this guide, we will break down the mechanics of candlestick patterns, explore the most reliable setups, explain why market context is vital, and show you how modern tools like Trade AI chart analysis can help validate what you see on the screen.
1. The Anatomy of a Candlestick: What Price Action Really Means
Before you can recognize complex formations, you must understand what an individual candlestick communicates. Every candlestick illustrates four primary data points—known as OHLC—over a designated timeframe (such as 5 minutes, 1 hour, or 1 day):
- Open: The starting price of the asset during that period.
- High: The highest price achieved within the period.
- Low: The lowest price recorded during the period.
- Close: The final transacted price when the period concluded.
The Real Body
The colored block between the open and the close is the real body. A green candle indicates bullish price action where the close was higher than the open, while a red candle indicates bearish price action where the close was lower than the open. A wide, tall body demonstrates aggressive momentum and conviction.
The Shadows (Wicks)
The thin vertical lines extending above and below the body are the shadows or wicks. These represent price rejection. A long upper wick reveals that buyers attempted to push the price higher, but sellers forced it back down before the close. A long lower wick indicates that sellers drove price down, but buyers stepped in to absorb supply.
2. Essential Candlestick Patterns Every Retail Trader Should Know
While there are dozens of named patterns, memorizing all of them is unnecessary. Mastering a handful of high-probability reversal and continuation setups provides a reliable foundation.
Single-Candle Patterns
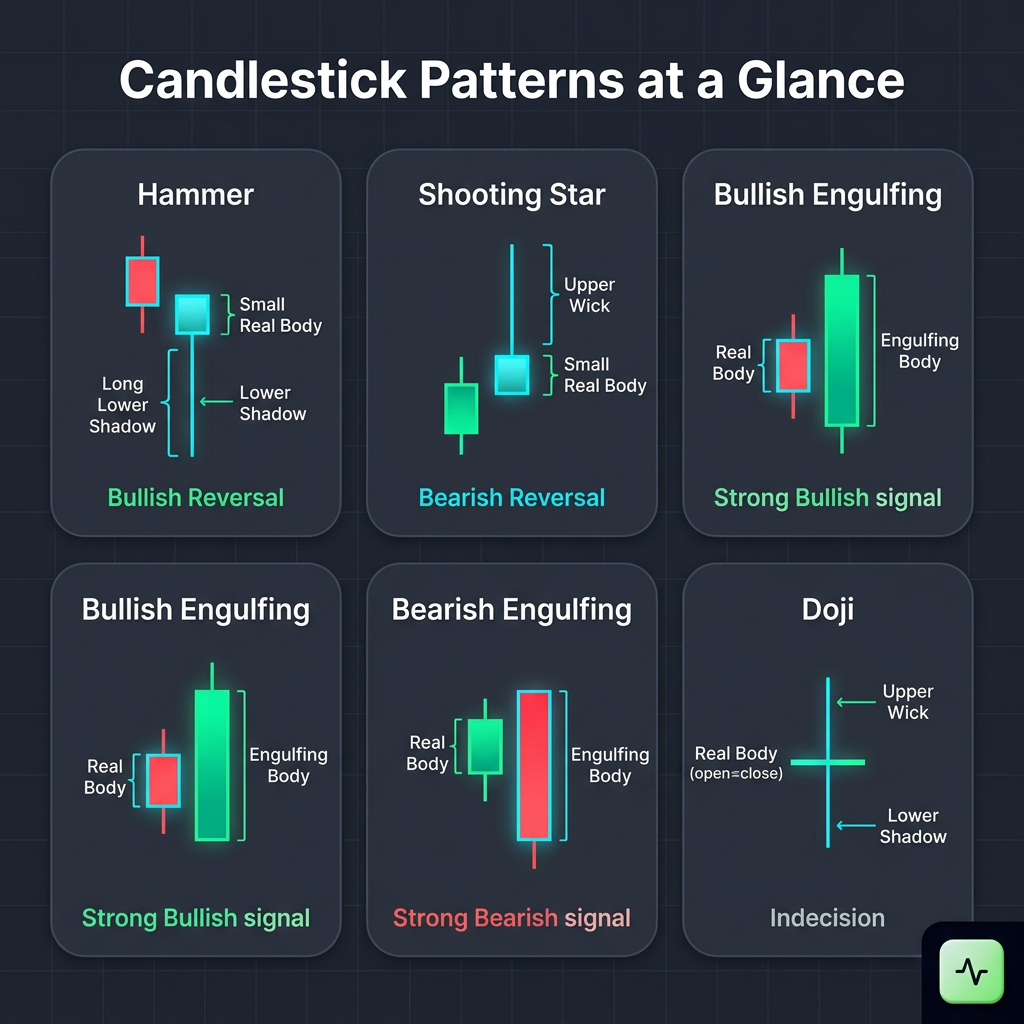
The Hammer and the Inverted Hammer: The Hammer is a bullish reversal pattern that typically appears at the bottom of a downtrend. It features a small upper body and a long lower shadow—at least twice the length of the body. It shows that bears drove prices down to new lows, but bulls rejected the selloff. The Inverted Hammer features an extended upper wick after a decline, signaling early buying interest.
The Shooting Star: The bearish counterpart to the inverted hammer is the Shooting Star. Occurring after an established uptrend, it has a small lower body and an extended upper wick, showing that buyers were overwhelmed by sellers before the candle closed.
The Doji: A Doji forms when open and close prices are virtually identical. It reflects indecision and equilibrium between market participants, warning traders that prevailing momentum may be slowing.
Multi-Candle Patterns
Bullish and Bearish Engulfing: In a Bullish Engulfing pattern, a small red candle is followed by a large green candle that completely engulfs it, signaling that buyers have taken control. In a Bearish Engulfing pattern, a small green candle is engulfed by a large red candle, indicating heavy distribution.
Morning Star and Evening Star: A Morning Star is a three-candle bullish reversal formation consisting of a long red candle, a small indecisive candle, and a strong green candle. An Evening Star is its bearish counterpart, signaling a transition from bullish momentum to downward pressure.
3. Market Context: Why Patterns Fail in Isolation
A common mistake among retail traders is treating candlestick patterns as automatic buy or sell signals. A hammer candle forming in the middle of a choppy, directionless market carries very little predictive value.
To trade candlestick patterns effectively, you must interpret them within broader market context:
- Key Support and Resistance Levels: A bullish engulfing candle that forms directly on a multi-week horizontal support level or trendline is significantly more meaningful than one appearing in empty chart space.
- Prevailing Trend Direction: Reversal patterns require an established trend to reverse. A hammer requires a clear preceding downtrend to be valid.
- Overall Market Structure: Is the asset establishing clean higher-highs or moving in a sideways range? Context provides the lens that transforms a random pattern into a logical setup.
For a deeper look into foundational chart reading principles, resources like Investopedia's technical analysis library offer extensive breakdowns of structural support and resistance theory.
4. Avoiding False Signals: Confirmation and Risk Management
Every trader encounters false breakouts. A pattern may look perfect, only for the next bar to collapse. Protecting your capital requires disciplined confirmation rules:
- Volume Confirmation: Candlestick patterns backed by above-average volume carry higher weight, signaling genuine institutional interest.
- Wait for the Candle Close: Never anticipate a pattern before the timeframe finishes. A candle can change its appearance drastically in its final minutes.
- Multi-Timeframe Alignment: Confirm setups on higher timeframes to ensure you are not trading directly against a macro trend.
- Define Your Invalidation Point: Always establish an invalidation level, such as placing a stop-loss just below the lower wick of a hammer.
5. Elevating Your Pattern Recognition with Trade AI
Manually scanning dozens of charts across stocks, crypto, and forex can lead to analysis fatigue. This is where Trade AI functions as an educational and analytical co-pilot for individual traders.
Using AI Chart Analysis, you can upload a chart screenshot or select an asset ticker to let the platform highlight pattern formations, locate underlying support and resistance levels, and provide a structured breakdown of market bias.
Traders can also cross-examine their visual pattern observations with AI Trading Signals, which include recommended entries, stop-loss zones, and take-profit targets. If you are refining your strategy, the built-in Trading Simulation tool enables you to practice trading price action setups with real-time market data without putting actual capital at risk.
Summary: Key Takeaways for Reading Price Action
- Candlesticks reflect sentiment: Bodies indicate directional conviction, while wicks show rejected price levels.
- Master core formations: Focus on high-probability setups like hammers, shooting stars, and engulfing candles.
- Context is critical: Always evaluate patterns against major support, resistance, and market trends.
- Confirm before acting: Use volume, candle closes, and strict stop-loss rules to avoid false signals.
- Leverage modern tools: Validate setups and practice safely using Trade AI's Chart Analysis and Trading Simulation.
Frequently Asked Questions (FAQ)
What is the most reliable candlestick pattern?
No single pattern is universally the most reliable. However, multi-candle reversal formations like the Bullish Engulfing and Morning Star tend to have higher historical success rates when they occur at verified support levels with expanding volume.
On which timeframe do candlestick patterns work best?
Candlestick patterns are effective across all timeframes, but higher timeframes like the 4-hour, daily, or weekly charts produce fewer false signals than lower timeframes where market noise is elevated.
Why do candlestick patterns sometimes fail?
Patterns fail because markets are driven by dynamic liquidity, breaking news events, and institutional order flow. When a pattern lacks volume confirmation or occurs in a directionless consolidation zone, it is prone to failing.
How does Trade AI help me read candlestick charts?
Trade AI provides an AI Chart Analysis tool that evaluates pattern structures from symbols or uploaded chart images, highlights key support and resistance zones, and provides objective market context to support your decision-making.
Disclaimer: Trade AI provides AI-generated market analysis, signals and insights for informational and educational purposes only. This content does not constitute financial, investment or trading advice, nor is it a recommendation to buy or sell any financial instrument. Markets are inherently unpredictable, and past or AI-generated analysis does not guarantee future results. Always conduct your own research and apply appropriate risk management before making any financial decision.
Frequently asked questions
- What is the most reliable candlestick pattern?
- No single pattern is 100% reliable. However, multi-candle reversal patterns like the Bullish Engulfing and Morning Star tend to have higher reliability when they coincide with established support levels and high trading volume.
- On which timeframe do candlestick patterns work best?
- Candlestick patterns work on any timeframe, but higher timeframes like the 4-hour, daily, and weekly charts filter out market noise and generally produce more dependable signals than intraday 1-minute or 5-minute charts.
- Why do candlestick patterns sometimes fail?
- Patterns fail due to sudden liquidity shifts, unexpected economic news, or because the pattern formed in a choppy, sideways market without clear support or resistance backing.
- How does Trade AI help me read candlestick charts?
- Trade AI provides an AI Chart Analysis tool that identifies patterns, trendlines, and key support/resistance levels from live ticker data or chart screenshot uploads, giving retail traders an objective, educational second opinion.