Automated Support and Resistance Mapping: How AI Chart Vision Identifies Dynamic Liquidity Zones
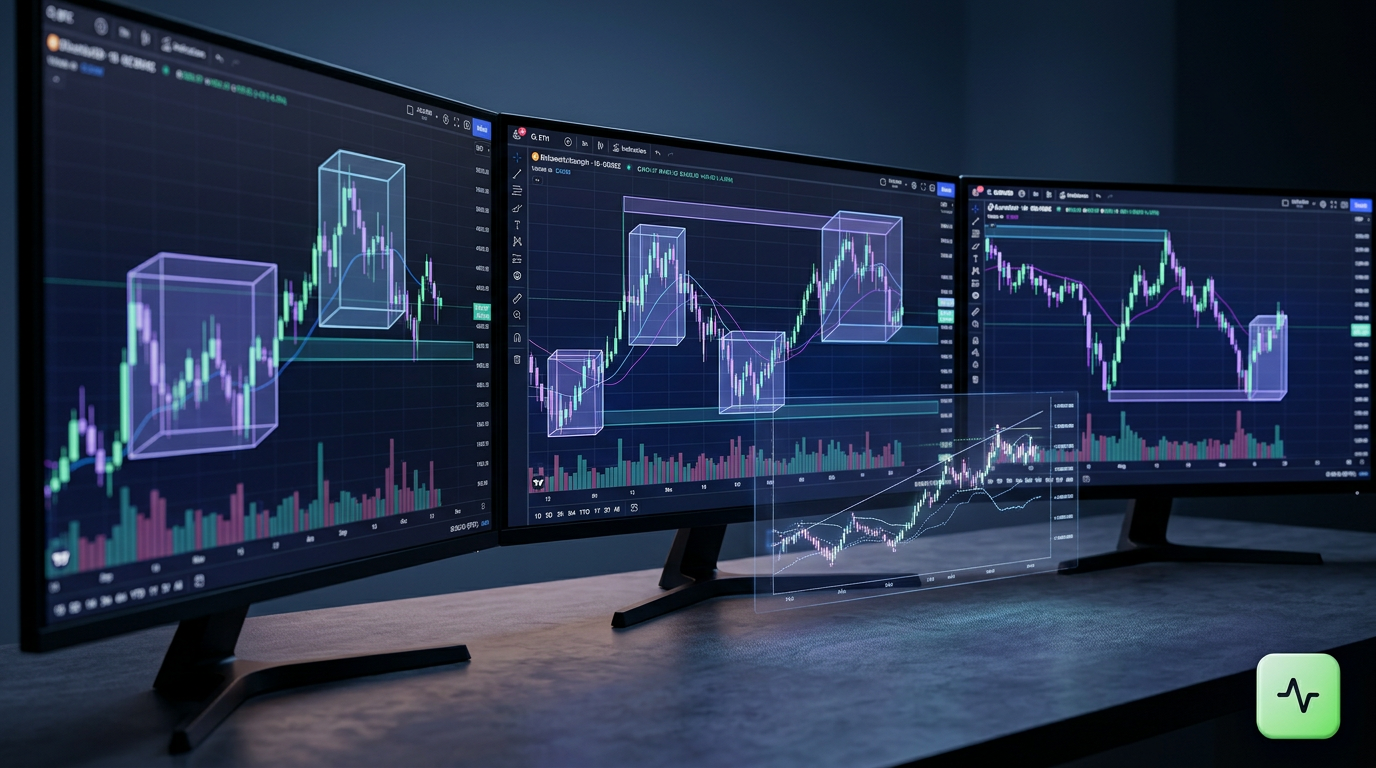
Automated Support and Resistance Mapping: How AI Chart Vision Identifies Dynamic Liquidity Zones
Every trader knows the familiar frustration of drawing a crisp, horizontal line across a chart, watching price approach it with textbook precision, and then witnessing a sudden wick punch straight through your level before reversing in the intended direction.
Manual technical analysis has long relied on static support and resistance lines. While horizontal price levels provide a basic historical reference, modern financial markets rarely respect rigid, single-price boundaries. Markets are fluid auction environments driven by institutional resting orders, algorithmic rebalancing, and shifting sentiment.
Today, artificial intelligence is transforming how everyday retail traders approach chart mapping. Through computer vision and machine learning models trained on millions of candlestick formations, AI chart pattern recognition helps identify dynamic liquidity zones—regions where buy and sell interest actually cluster—rather than relying on arbitrary horizontal lines.
In this guide, we explore how automated support and resistance mapping works, how AI chart vision detects hidden supply and demand zones, and how you can integrate these automated insights into your daily market research.
Beyond Static Lines: Why Traditional Support and Resistance Often Fails
Traditional technical analysis teaches traders to connect previous swing highs and lows with horizontal lines. While this foundational concept introduces structure to market data, it often falls short in modern, fast-moving markets across equities, forex, and cryptocurrencies.
The Problem with Single-Price Points
Markets do not operate on exact ticks; they operate in zones. When a stock approaches an old high of $150.00, large institutional participants do not execute entire multi-million-dollar orders at exactly $150.00. Instead, orders sit distributed across a range—such as $149.20 to $150.80—absorbing liquidity as price fluctuates. Treating a level as a pinpoint line often leads to premature exits, mistimed entries, or frustration over "false breakouts."
Subjectivity and Chart Bias
Ask five different traders to mark support and resistance on the exact same daily chart, and you will likely get five different variations. One trader draws lines across candlestick bodies; another anchors them to wick extremes. Another ignores several touches to fit a preconceived bullish thesis. This subjectivity introduces confirmation bias, causing traders to see what they want to see rather than what the auction data actually shows.
According to educational research from Investopedia on Support and Resistance, these levels represent areas where buyers or sellers find equilibrium. Translating that equilibrium into actionable analysis requires looking at price structure as a dynamic, evolving band of liquidity.
What Is AI Chart Vision and How Does It Work?
AI chart vision uses specialized computer vision algorithms to evaluate financial charts much like a seasoned market analyst would—evaluating price structure, candlestick patterns, and volume profiles simultaneously, but without fatigue or emotional bias.
Instead of applying a simple mathematical formula (like a pivot point indicator), computer vision models process the spatial relationships between price bars. They analyze:
- Wick Rejection Clusters: Areas where multiple candles leave long wicks over varying time intervals, indicating strong, repeated absorption of orders.
- Volume-Weighted Consolidation: Tightly bound price ranges accompanied by volume shifts, marking where accumulation or distribution took place.
- Market Structure Transitions: Changes in higher highs and higher lows, distinguishing between temporary pullbacks and genuine trend reversals.
With platforms like Trade AI, retail traders can access this capability directly through AI Chart Analysis. By simply inputting a symbol or uploading a screenshot of any chart from your favorite trading platform, the AI scans the visual data, maps key zones, and highlights prevailing market bias in seconds.
Spotting Dynamic Liquidity Zones: High-Probability Areas Where Orders Cluster
What separates a standard support level from a dynamic liquidity zone? Liquidity zones represent areas where resting orders (stop-losses, limit orders, and breakout entries) naturally pool together.
Understanding Liquidity Pools
In any financial instrument, market makers and institutional desks require sufficient liquidity to fill sizable positions without causing excessive slippage. These pools naturally form just above prominent swing highs (where breakout buyers and short-seller stop-losses accumulate) and just below swing lows (where breakdown sellers and long stop-losses reside).
When price drives into these areas, novice traders often mistake the initial move for a confirmed breakout. Conversely, AI vision identifies these structural sweeps and alerts users when price enters high-liquidity territory, allowing traders to evaluate whether the move shows true continuation or exhaustion.
Supply and Demand Imbalances
Dynamic zones also capture "fair value gaps" or imbalances—moments where aggressive buying or selling caused price to leap forward so rapidly that two-sided trade was skipped. AI chart analysis flags these inefficiently traded areas, as price frequently retraces into them to rebalance liquidity before continuing its primary trend.
A Practical Workflow: Using Trade AI in Your Daily Routine
Automating your chart mapping does not mean handing over your decision-making. Instead, it provides an objective, analytical foundation so you can spend less time drawing manual lines and more time evaluating high-quality setups.
Here is a step-by-step workflow for incorporating automated support and resistance into your routine:
Step 1: Scan Your Watchlist
Start by curating your core assets—whether major forex pairs, tech stocks, or high-volume cryptocurrencies—using Trade AI Watchlists. Scanning an organized list allows you to quickly monitor which assets are trading near major historical inflection points.
Step 2: Run AI Chart Analysis
Once an asset catches your attention, run the Trade AI Chart Analysis feature. You can analyze a symbol using live market data or drop in a chart screenshot. The AI evaluates the timeframe, detects relevant candlestick formations, draws dynamic support/resistance zones, and summarizes the current technical bias.
Step 3: Check Cross-Market Context
Is your stock approaching a resistance band right before a major earnings report or interest rate decision? Check the News & Market Sentiment feed to see how breaking news and sentiment scoring might affect liquidity around that zone.
Step 4: Validate with Paper Trading
Never risk capital on an unfamiliar setup. With Trade AI Trading Simulation, you can test trade ideas based on automated liquidity zones within a risk-free virtual environment. Track your simulated entry, stop-loss, and profit targets to evaluate how well the levels hold up over time.
Step 5: Stay Informed via the Telegram Bot
If you step away from your desk, use the Trade AI Telegram Bot to request chart analysis or check signal parameters directly from your mobile device, keeping your market research accessible anywhere.
Enhancing Risk Management with Automated Liquidity Mapping
The greatest advantage of automated liquidity mapping is not necessarily finding where to enter a trade—it is knowing where not to place your risk.
Many retail traders place stop-loss orders directly beneath a visible horizontal line, creating an obvious target for market volatility. By mapping wider dynamic liquidity zones, you can:
- Set Cleaner Stop-Losses: Position protective stops outside the entire liquidity band rather than right at the edge of an obvious swing point.
- Identify Realistic Multi-Target Take-Profits: Align your profit targets with the beginning of an opposing supply zone rather than assuming price will reach extreme highs.
- Avoid Chasing Breakouts: Recognize when a breakout is merely testing dynamic overhead resistance, saving you from buying at the top of a range.
As noted by financial authorities like the CFTC Investor Education Resources, consistent risk management and understanding market mechanics are essential components of long-term trading education.
Summary / Key Takeaways
- Static Lines Are Limited: Traditional horizontal lines ignore the fluid auction nature of markets, leading to false breakouts and subjective bias.
- AI Understands Structure: AI chart vision analyzes candlestick clusters, wicks, and volume behavior to map realistic dynamic liquidity zones.
- Liquidity Pools Dictate Movement: Price naturally seeks areas where resting stop-losses and limit orders cluster; recognizing these zones prevents common trading traps.
- Objective Market Research: Automated mapping saves time, removes emotional bias, and provides a clear technical foundation across stocks, forex, and crypto.
- Risk Management Comes First: Dynamic zones provide better reference points for setting realistic stop-losses and take-profit targets.
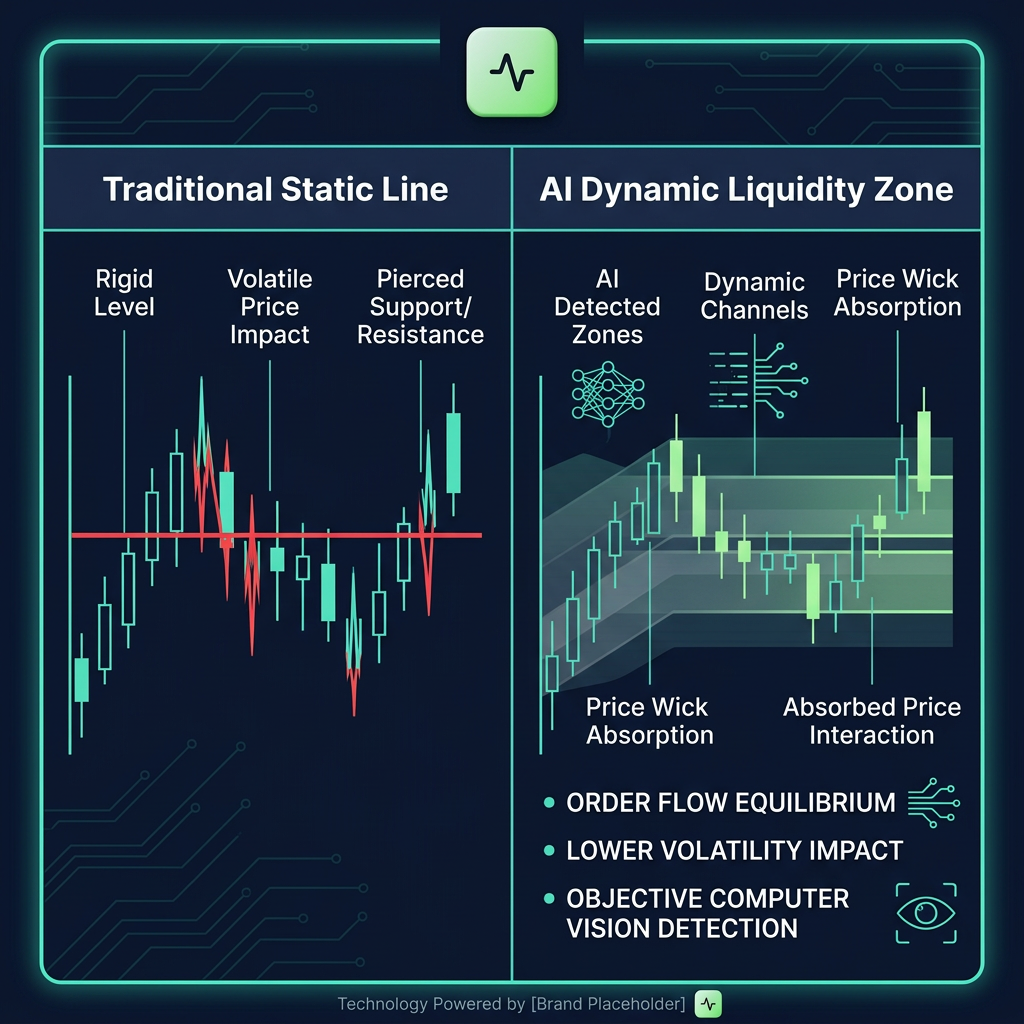
Infographic: Static Lines vs. Dynamic AI Liquidity Zones
A comparison overview highlighting how dynamic AI mapping identifies supply and absorption pockets compared to traditional single-price horizontal markings.
Start Your Market Analysis with Trade AI
Ready to eliminate subjective guesswork from your chart analysis? Explore how AI-driven market intelligence can support your research. Sign up for Trade AI today to analyze charts, monitor market sentiment, and test your trading strategies in a simulated, educational environment.
Frequently Asked Questions (FAQ)
What is the difference between a support level and a liquidity zone?
A traditional support level is typically drawn as a single horizontal line based on past price touches. A liquidity zone is a broader price band where significant buy or sell orders (including stop-losses and limit orders) are concentrated, reflecting the auction dynamics of the market.
Can AI chart analysis predict future market movements?
No tool or artificial intelligence can predict market movements with complete certainty. Trade AI's chart vision is designed as an educational and analytical aid that maps existing market structure, patterns, and historical zones to help users make more structured, informed evaluations.
Does Trade AI work with both live charts and screenshots?
Yes. You can run AI Chart Analysis directly on supported symbols using live market data, or you can upload a clear screenshot of any chart from your trading platform to receive automated pattern recognition, trend bias, and key level identification.
Which asset classes are supported by Trade AI?
Trade AI provides market data, chart analysis, and AI signals across major global equities, cryptocurrencies, foreign exchange (Forex), and commodities.
How does dynamic support mapping help with risk management?
By highlighting the full breadth of a liquidity zone, dynamic mapping helps you avoid placing stop-loss orders in vulnerable, obvious spots where brief wicks commonly cause premature stop-outs. It also highlights logical target areas before price encounters opposing order flow.
Disclaimer: Trade AI provides AI-generated market analysis, signals and insights for informational and educational purposes only. This content does not constitute financial, investment or trading advice, nor is it a recommendation to buy or sell any financial instrument. Markets are inherently unpredictable, and past or AI-generated analysis does not guarantee future results. Always conduct your own research and apply appropriate risk management before making any financial decision.
Frequently asked questions
- What is the difference between a support level and a liquidity zone?
- A traditional support level is typically drawn as a single horizontal line based on past price touches. A liquidity zone is a broader price band where significant buy or sell orders (including stop-losses and limit orders) are concentrated, reflecting the auction dynamics of the market.
- Can AI chart analysis predict future market movements?
- No tool or artificial intelligence can predict market movements with complete certainty. Trade AI's chart vision is designed as an educational and analytical aid that maps existing market structure, patterns, and historical zones to help users make more structured, informed evaluations.
- Does Trade AI work with both live charts and screenshots?
- Yes. You can run AI Chart Analysis directly on supported symbols using live market data, or you can upload a clear screenshot of any chart from your trading platform to receive automated pattern recognition, trend bias, and key level identification.
- Which asset classes are supported by Trade AI?
- Trade AI provides market data, chart analysis, and AI signals across major global equities, cryptocurrencies, foreign exchange (Forex), and commodities.
- How does dynamic support mapping help with risk management?
- By highlighting the full breadth of a liquidity zone, dynamic mapping helps you avoid placing stop-loss orders in vulnerable, obvious spots where brief wicks commonly cause premature stop-outs. It also highlights logical target areas before price encounters opposing order flow.