ATR Explained: How to Understand Market Volatility and Trading Risk
ATR Explained: How to Understand Market Volatility and Trading Risk
Every active trader quickly discovers that markets rarely move in a smooth, predictable line. One day, a stock might drift gently across a fifty-cent channel; the next day, an earnings release or economic headline sends it swinging through a four-dollar range. If you treat both of these market environments the same way, your risk management plan will struggle.
This is where understanding volatility becomes essential. Rather than simply asking where price is heading, successful market participants ask how vigorously price is moving. The ATR indicator (Average True Range) is designed specifically to answer that question.
In this guide, we will unpack how the ATR indicator works, how to read its values across different assets, and how you can use it to set objective, volatility-adjusted stop losses instead of relying on guesswork.
What Is the ATR Indicator and How Does It Work?
Introduced by legendary technical analyst J. Welles Wilder Jr. in his 1978 book New Concepts in Technical Trading Systems, the Average True Range was originally created to capture the erratic price swings common in commodity markets. Today, it remains one of the most widely applied volatility tools across equities, forex, and cryptocurrency.
Unlike momentum oscillators such as the Relative Strength Index (RSI) or trend tools like moving averages, the ATR indicator does not predict directional bias. It does not tell you whether an asset will go up or down. Instead, it measures the degree of price movement over a specified period.
Understanding the "True Range"
To grasp how the ATR indicator functions, you first need to understand the concept of "True Range" (TR). In a simple intraday view, a session's range is just the high minus the low. However, Wilder recognized that markets often gap up or down between sessions, leaving standard high-minus-low calculations incomplete.
The True Range solves this by evaluating three distinct calculations for any given period:
- The current high minus the current low.
- The absolute value of the current high minus the previous close.
- The absolute value of the current low minus the previous close.
The largest of these three numbers is recorded as the True Range for that bar. By taking gaps into account, True Range provides an honest representation of the asset's actual price dispersion.
From True Range to Average True Range
The standard ATR indicator smooths these daily True Range readings using an exponential moving average—conventionally set over 14 periods. If you are looking at a daily chart, a 14-period ATR reflects the average trading range over the past 14 trading days, presented in the base currency points of the underlying asset.
How to Read ATR: High vs. Low Volatility
Because the ATR indicator displays as an absolute value rather than a percentage, its numerical output corresponds directly to the price scale of the asset you are evaluating.
For example:
- An ATR reading of 2.50 on a $120 tech stock means the share price has moved an average of $2.50 per day over the last 14 sessions.
- An ATR reading of 0.0075 on the EUR/USD currency pair means the exchange rate has moved an average of 75 pips per day.
- An ATR reading of 1,850 on Bitcoin indicates an average daily fluctuation of $1,850.
Interpreting High ATR Readings
When the ATR indicator climbs upward, it signals that market volatility is expanding. Price bars are stretching, and market participants are aggressively revaluing the asset. While high volatility can offer wider profit targets for day and swing traders, it also brings wider risk. Slippage can increase, and normal market noise can easily trigger overly tight stops.
Interpreting Low ATR Readings
A declining or subdued ATR line points to consolidation. Price action is compact, volume often drops, and the asset is trading within a tightening range. Prolonged periods of low ATR frequently precede powerful breakout moves, as markets naturally cycle between periods of quiet compression and violent expansion.
Practical Application: Smarter Stop-Loss Placement with ATR
One of the most common mistakes retail traders make is applying arbitrary percentage stops. Placing a rigid 2% stop-loss on every trade might sound disciplined on paper, but it ignores the physical reality of the chart.
If you place a 2% stop on a stock that typically fluctuates 4% on an average morning, normal market noise will knock you out of your position before your trade idea has room to develop. Conversely, giving a 2% stop to an ultra-stable index might expose you to unnecessary downside before invalidating your thesis.
Using the ATR indicator creates an objective, adaptive safety buffer.
Dynamic Stop Formula:
Long Stop Price = Entry Price - (ATR × Multiplier)
Short Stop Price = Entry Price + (ATR × Multiplier)
Choosing Your ATR Multiplier
A common baseline among technical swing traders is using a 1.5x to 2x ATR multiple:
- Identify the Entry Point: Suppose you decide to buy an equity at $50.00 following a confirmed breakout.
- Check the Current 14-Day ATR: Assume the ATR indicator displays $1.20.
- Calculate the Buffer: Using a 2x multiple, your volatility buffer is $2.40 ($1.20 × 2).
- Set the Stop-Loss: Your stop sits at $47.60 ($50.00 - $2.40).
By anchoring your exit beyond the average daily swing, you prevent everyday market oscillations from closing your trade prematurely, while still maintaining a firm exit point if price genuinely reverses against you.
Trailing Stops with the Chandelier Exit
You can also use the ATR indicator dynamically to lock in unrealized gains through an ATR-based trailing stop, often known as the Chandelier Exit. Rather than anchoring to your initial entry, the stop trails a set multiple of ATR below the highest high reached during the life of the trade. As long as momentum continues, the stop ratchets higher, letting winners run while preserving accumulated upside when volatility snaps back.
Volatility-Based Position Sizing
Managing risk is not only about knowing where to get out; it is equally about knowing how much to buy. When you combine the ATR indicator with standard account sizing rules, your overall portfolio risk remains stable across different market conditions.
For example, comparing two assets at the same $100 price level:
- Calm Asset: An ATR of $1.50 with a 2x ATR stop gives a $3.00 stop distance. On a $300 account risk allowance, you could trade 100 shares.
- Volatile Asset: An ATR of $4.50 with a 2x ATR stop creates a $9.00 stop distance. On the same $300 account risk allowance, you would adjust your size down to 33 shares.
Notice that even though both stocks trade at the exact same share price, the more volatile asset requires you to reduce your position size to one-third. By letting the ATR indicator dictate your sizing, a sudden adverse move will not inflict disproportionate damage on your portfolio.
How Trade AI Helps You Monitor Volatility and Manage Risk
Calculating metrics manually or constantly recalibrating stop levels across dozens of watchlist symbols can quickly become overwhelming. Modern tools help simplify this analysis so you can focus on making clear, well-reasoned choices.
Within the Trade AI platform, individual traders can streamline their market analysis and risk modeling:
- Comprehensive Market Data: Monitor real-time charts and overlay indicators like the ATR indicator across stocks, forex, commodities, and crypto in a unified interface.
- AI Chart Analysis: If you are unsure whether a consolidation pattern is setting up a high-volatility breakout, you can analyze any asset or upload chart screenshots to Trade AI's vision engine for automated support, resistance, and structure detection.
- AI Trading Signals: Review generated signals across multiple asset classes that provide pre-calculated entry points, stop-loss boundaries, and take-profit targets informed by underlying market conditions and volatility.
- Simulated Trading & Portfolio Management: Before risking capital on dynamic ATR stops, test your strategies in the Trade AI Trading Simulation. Build a paper portfolio, assess risk behavior, and track simulated outcomes without financial pressure.
Combining objective technical tools like the ATR indicator with AI-powered market intelligence allows you to approach volatile sessions with clarity and structured discipline.
Summary / Key Takeaways
- Pure Volatility Metric: The ATR indicator measures the magnitude of price movement over time; it does not indicate trend direction or provide buy/sell signals on its own.
- True Range Accounts for Gaps: By evaluating the highest of current high-low, high-previous close, and low-previous close, ATR accurately reflects price expansion across market sessions.
- Dynamic Risk Management: Replacing rigid percentage stops with ATR multiples (e.g., 1.5x–2x ATR) prevents standard market noise from triggering premature exits.
- Balanced Position Sizing: High ATR values demand smaller position sizes, while low ATR values allow for standard allocations, ensuring portfolio risk remains balanced.
- Integrated Tools: Combining traditional indicators with platforms like Trade AI helps traders spot shifts in volatility and test risk setups safely.
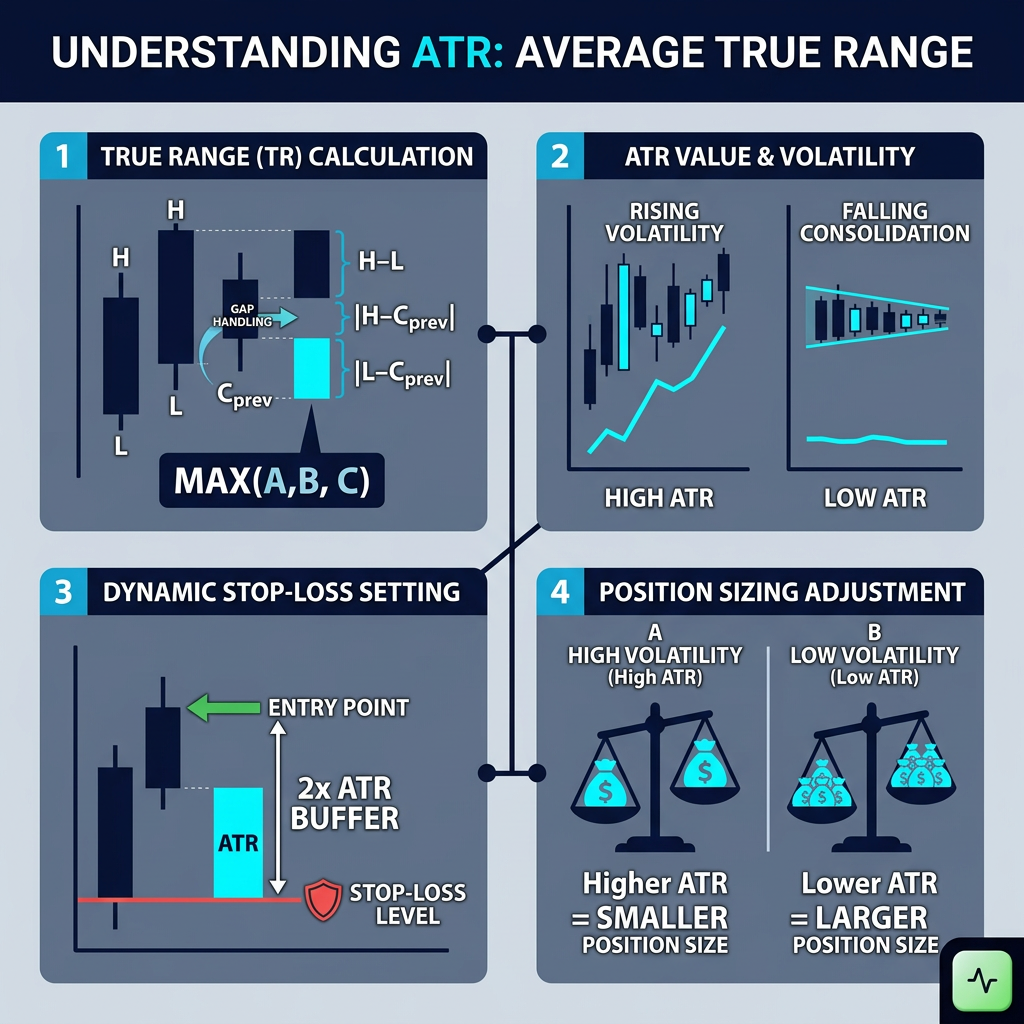
Infographic: The Trader's Guide to Average True Range
Summary visualization breakdown:
- 1. The Math: True Range calculation factoring intraday range and overnight session price gaps.
- 2. The Signal: Rising ATR = expanding volatility and larger swings; Falling ATR = tight consolidation and potential breakout setup.
- 3. The Application: Setting stops at
Entry Price - (1.5 to 2.0 × ATR)to stay outside common market noise. - 4. The Principle: Normalize position size according to volatility so every trade carries equal account risk.
Start Your Market Analysis with Trade AI
Navigating shifting market volatility does not have to rely on guesswork. Whether you are tracking daily breakouts, fine-tuning your stop-loss parameters, or testing paper-trading strategies, Trade AI gives you the market intelligence, charts, and AI-driven insights you need to make informed decisions.
Ready to elevate your trading routine? Explore Trade AI today and see how intelligent analytics can support your market research.
Frequently Asked Questions
What is the best timeframe to use with the ATR indicator?
The standard setting for the ATR indicator is 14 periods. On daily charts, this captures nearly three weeks of trading action, making it ideal for swing trading and macro position sizing. For intraday day trading, a 14-period ATR applied to a 5-minute or 15-minute chart reflects recent intraday momentum and short-term volatility.
Does a high ATR mean it is time to buy?
No. The ATR indicator is non-directional. A surging ATR simply tells you that price bars are expanding and volatility is elevated. An asset in a steep downtrend can register the exact same high ATR value as an asset in an explosive rally.
Why does the ATR value differ between assets?
ATR is calculated in the absolute price units of the asset being analyzed. A stock trading at $300 will naturally have a much higher numerical ATR than a stock trading at $15 or a currency pair quoted in fractions of a cent. To compare volatility between two different assets, traders often evaluate ATR as a percentage of the asset's current price.
Can the ATR indicator be used for profit targets?
Yes. Many traders use ATR multiples to establish realistic take-profit targets. For instance, if you establish a 2x ATR stop-loss, you might set your profit target at 3x or 4x ATR. This ensures your potential reward remains proportional to the current volatility environment.
Disclaimer: Trade AI provides AI-generated market analysis, signals and insights for informational and educational purposes only. This content does not constitute financial, investment or trading advice, nor is it a recommendation to buy or sell any financial instrument. Markets are inherently unpredictable, and past or AI-generated analysis does not guarantee future results. Always conduct your own research and apply appropriate risk management before making any financial decision.
Frequently asked questions
- What is the best timeframe to use with the ATR indicator?
- The standard setting is 14 periods. On daily charts, this captures nearly three weeks of trading, ideal for swing trading and position sizing. For intraday day trading, a 14-period ATR on 5-minute or 15-minute charts captures immediate volatility.
- Does a high ATR mean it is time to buy?
- No. The ATR indicator is strictly non-directional. A high ATR indicates large price swings and expanding volatility, which can occur during both aggressive bull runs and sharp market sell-offs.
- Why does the ATR value differ between assets?
- ATR is measured in the underlying currency or point value of the asset. A $300 stock will naturally display a much higher dollar ATR than a $10 stock or a forex pair quoted in fractional cents.
- Can the ATR indicator be used for profit targets?
- Yes. Traders commonly use ATR multiples (such as 3x or 4x ATR) to set profit targets that stay proportional to the asset's current volatility, pairing naturally with a 1.5x or 2x ATR stop-loss.