AI Trading Signals Explained: What Entry, Stop-Loss, Targets & Confidence Really Mean

AI Trading Signals Explained: What Entry, Stop-Loss, Targets & Confidence Really Mean
If you have spent any time exploring modern financial markets, you have likely encountered automated alerts or algorithm-driven notifications promising to simplify market analysis. Artificial intelligence has fundamentally transformed how retail traders examine stocks, cryptocurrencies, forex, and commodities.
Yet, for many everyday traders, opening an AI signal alert can feel like deciphering a cryptic code. You see numbers labeled Entry, SL, TP1, TP2, accompanied by a percentage labeled Confidence or a directional label like Bullish Bias.
What do these figures actually mean? How are they calculated, and more importantly, how can an everyday trader use them responsibly without treating them as crystal balls?
This guide breaks down every core element of an AI-generated trading signal into clear, plain English so you can navigate market research with confidence and discipline.
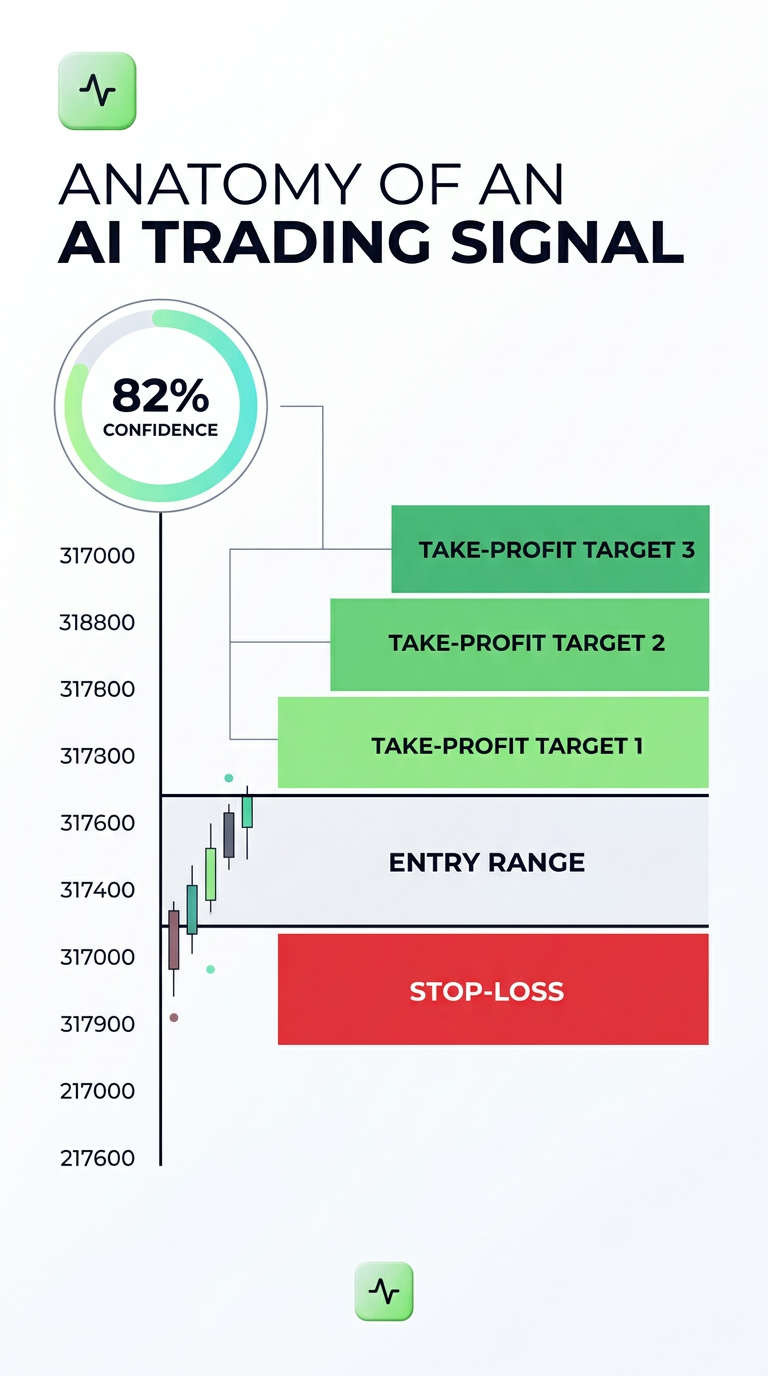
1. The Anatomy of an AI Trading Signal
At its core, an AI trading signal is not a financial directive or a guaranteed prediction. Instead, think of it as a structured technical hypothesis produced by computing models that scan price action, volume, technical indicators, and historical chart patterns faster than any human could.
When a market intelligence platform like Trade AI generates a signal, it compiles raw market data into an actionable summary. Rather than requiring you to manually overlay moving averages, calculate support and resistance levels, and track relative volume across dozens of charts, the system presents an organized breakdown comprising:
- Directional Bias: Whether the pattern suggests an upward (Long/Bullish) or downward (Short/Bearish) continuation.
- Entry Range: The price zone where conditions align according to the model.
- Stop-Loss (SL): The protective invalidation level where the setup is considered broken.
- Take-Profit (TP) Targets: Logical exit points based on historical resistance, Fibonacci extensions, or volatility multiples.
- Confidence Score: A probabilistic metric reflecting historical pattern resemblance and confluence across indicators.
Understanding these components converts a confusing stream of numbers into an intuitive framework for evaluating risk.
2. Entry Price: Finding Strategic Timing, Not Just Instant Execution
One of the most frequent misconceptions among beginner traders is that an entry price means you must hit "Buy" the exact second an alert appears on your screen.
In practical trading, the Entry represents an optimal price area where the probability of a favorable move outweighs the immediate downside risk.
Market Entry vs. Limit Pullbacks
Signals generally outline two primary approaches to entry:
- Breakout / Momentum Entry: Triggered when price crosses a critical threshold with expanding volume, indicating strong institutional participation.
- Pullback / Retest Entry: Designed to wait for the asset to retrace back toward a confirmed support or moving average level before initiating an idea.
Platforms like Trade AI evaluate multiple data inputs—such as historical candle shapes and volume spikes—to determine whether an asset is overextended. If a signal highlights an entry zone slightly below current market price, it suggests that patience may offer a far better risk-to-reward balance than chasing a runaway green candle.
3. The Stop-Loss (SL): Your Essential Defense Mechanism
If you take only one lesson from this guide, let it be this: the stop-loss is the most critical number in any trading signal.
Many retail market participants treat the stop-loss as an afterthought, focusing entirely on how much profit a trade could generate. In professional market analysis, survival always precedes profitability.
How AI Identifies Invalidation Levels
A reliable stop-loss is not placed at an arbitrary dollar amount. Instead, it is anchored to market structure. When Trade AI calculates a stop-loss level, it typically looks for:
- Structural Invalidation: A price point below key support (in a long trade) or above key resistance (in a short trade). If the price crosses this level, the original reason for taking the trade no longer exists.
- Volatility-Based Buffers: Utilizing tools such as the Average True Range (ATR) to ensure the stop is placed outside the normal "noise" of the asset’s daily fluctuations.
By following an objective stop-loss rather than emotional hope, you protect your capital so that a string of small, controlled losses never threatens your broader portfolio.
4. Take-Profit Targets (TP1, TP2, TP3): The Art of Scaling Out
Why do most professional AI signals provide two or three distinct target prices rather than just one?
The answer lies in trade management and emotional control. Markets rarely move in a single straight line; they advance in waves, encountering friction at prior highs, psychological round numbers, and volume shelves.
Entry: $100 → TP1: $105 (Lock partial gains / adjust risk) → TP2: $112 (Core target) → TP3: $120 (Extended trend runner)
Staging Your Exits
- Target 1 (TP1): Typically set near the nearest resistance level. Hitting TP1 offers an opportunity to lock in partial gains and adjust your stop-loss upward, effectively reducing remaining downside risk.
- Target 2 (TP2): Positioned at a secondary technical zone. This is often where the bulk of the position’s upside is realized.
- Target 3 (TP3): Designed for extended trending moves. Only a smaller portion of a position (often called a "runner") is kept active toward this level.
This staged approach prevents the common frustration of watching a winning position turn into a losing trade because you waited for an all-or-nothing outcome.
5. Decoding the "Confidence Score": Probabilities vs. Certainties
When a signal displays "Confidence: 78%", it is easy to assume the trade has a near-guarantee of success. This is a dangerous misunderstanding.
In machine learning and technical market modeling, a confidence score reflects confluence and historical pattern resemblance, not guaranteed future events. It indicates how closely the current technical setup aligns with historical scenarios where the identified pattern reached its targets under similar market regimes.
- 60% – 70%: Moderate alignment; baseline indicator confluence present, but overall market context or volume confirmation may be mixed.
- 71% – 85%: Strong alignment across multiple timeframes, clear structural boundaries, and complementary volume or sentiment profiles.
- 85%+: High confluence where momentum indicators, support/resistance levels, and trend metrics align closely with historically successful patterns.
Remember: even a setup with high algorithmic confluence can fail instantly if an unexpected macroeconomic headline or geopolitical event shifts market liquidity. Treat confidence scores as an indicator of setup quality, never as a replacement for disciplined sizing.
6. Practicing Without Financial Pressure
Reading about entries, invalidations, and target ladders is straightforward in theory, but putting them into action in real-time markets requires emotional composure.
Before allocating hard-earned capital to any signal setup, consider testing your understanding in a risk-free environment. Using Trade AI's Trading Simulation, you can execute paper trades directly against live market quotes across equities, crypto, and forex.
By tracking how simulated trades perform through TP1 and TP2—or watching how a stop-loss effectively limits downside—you develop mechanical discipline without the stress of financial loss. You can even double-check the visual validity of any setup using Trade AI's AI Chart Analysis, validating support and resistance zones visually before making an educational trade.
Summary & Key Takeaways
- Signals Are Maps, Not crystal balls: An AI trading signal provides a structured technical hypothesis based on confluence, historical patterns, and data analysis.
- Patience at Entry: Entering within the specified entry zone protects your risk-reward ratio; avoid chasing price outside the designated area.
- Prioritize the Stop-Loss: The invalidation level is the most vital piece of data on your screen. It defines your maximum risk and keeps you solvent.
- Scale Out with Multiple Targets: Using multi-target profit scaling (TP1, TP2) helps de-risk your positions and captures profits methodically.
- Confidence Means Confluence: A high confidence score reflects strong technical alignment, not an infallible prediction.
Start Your Market Analysis with Trade AI
Ready to demystify market movements and explore intelligent technical setups for stocks, crypto, forex, and commodities? Experience automated pattern detection, multi-asset signals, and comprehensive paper simulation tools all in one unified platform.
Try Trade AI for Free Today and start analyzing markets with structured clarity.
Frequently Asked Questions (FAQ)
Do AI trading signals guarantee winning trades?
No. Financial markets are dynamic and subject to unexpected news, macroeconomic shifts, and sudden liquidity changes. AI signals provide data-driven hypotheses based on historical technical confluence, but no algorithmic tool can guarantee future market behavior.
What should I do if the price moves past the recommended entry level?
If the price moves significantly beyond the designated entry range before you can review the setup, chasing it is generally discouraged. Entering late skews your risk-to-reward ratio by requiring a wider stop-loss for a smaller potential gain. It is often wiser to wait for a retracement or look for a fresh setup.
What is the difference between a 70% and a 90% confidence score?
A confidence score represents how closely current market conditions, technical indicators, and price patterns match historically successful setups in the platform's data models. A 90% score reflects very high confluence across multiple factors, but it remains a probability indicator rather than a guarantee.
Can I receive AI signals directly on my mobile phone?
Yes. Many retail traders prefer reviewing alerts on the go. Trade AI offers a dedicated Telegram integration that delivers real-time signal notifications, bias updates, and chart summaries directly to your device.
Disclaimer: Trade AI provides AI-generated market analysis, signals and insights for informational and educational purposes only. This content does not constitute financial, investment or trading advice, nor is it a recommendation to buy or sell any financial instrument. Markets are inherently unpredictable, and past or AI-generated analysis does not guarantee future results. Always conduct your own research and apply appropriate risk management before making any financial decision.
Frequently asked questions
- Do AI trading signals guarantee winning trades?
- No. Financial markets are dynamic and subject to unexpected macroeconomic shifts. AI signals provide data-driven hypotheses based on historical technical confluence, but no analytical tool guarantees future performance.
- What should I do if the price moves past the recommended entry level?
- If the price moves beyond the entry range before you can review the setup, avoid chasing it. Entering late degrades your risk-to-reward ratio. It is generally safer to wait for a retracement or evaluate a new setup.
- What does a trading signal confidence score actually measure?
- A confidence score reflects how closely the current market conditions, technical indicators, and price patterns match historically profitable setups within the AI model's training data. It indicates pattern confluence, not a certainty of outcome.
- Can I receive Trade AI signals directly on my phone?
- Yes. Trade AI provides a personal Telegram bot integration that sends real-time market signals, bias updates, and chart analysis directly to your phone.