AI Chart Vision vs. Traditional Technical Analysis: Automating Pattern Recognition at Scale
AI Chart Vision vs. Traditional Technical Analysis: Automating Pattern Recognition at Scale
For decades, technical analysis (TA) has occupied an uneasy space between quantitative geometry and subjective human interpretation. Retail traders, floor operators, and technical analysts look at candlestick charts to identify structural formations: double bottoms, descending triangles, head and shoulders, and dynamic liquidity sweeps.
However, turning those visual heuristics into high-throughput, systematic execution has historically been challenging. Scripting deterministic rules for geometric patterns across thousands of tickers and multiple timeframes leads to brittle codebases, false breakout cascades, and high maintenance overhead.
Recent advances in visual perception models and multimodal machine learning offer an alternative paradigm: AI chart computer vision. Rather than forcing fluid market dynamics into rigid mathematical heuristics, deep learning vision models evaluate chart geometry holistically, much like an expert human analyst, but with programmatic speed and consistency.
This article examines the technical trade-offs between traditional mathematical pattern detection and deep learning computer vision, exploring how quant developers and fintech engineers can use a modern chart pattern recognition API to build scalable, automated market analysis pipelines.
The Mechanics of Traditional Technical Analysis: Algorithmic Geometry
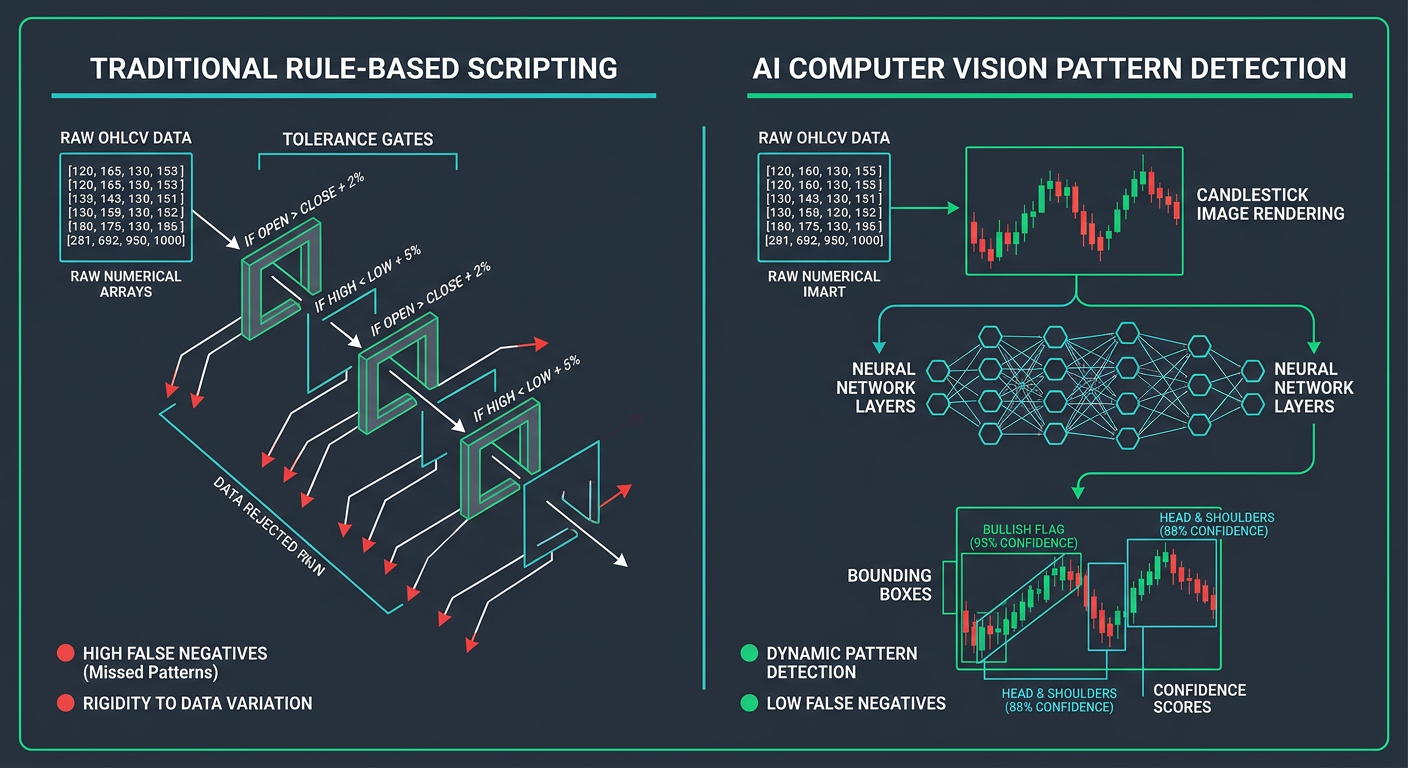
Traditional programmatic technical analysis converts continuous tick or OHLCV (Open, High, Low, Close, Volume) series into deterministic indicator values and geometric coordinates.
The Math-Based Approach
To detect a pattern like a "Double Bottom" programmatically using standard time-series scripting (such as Python, PineScript, or C++), developers typically implement a peak-and-trough algorithm:
- ZigZag or Local Extrema Extraction: Identify local minima and maxima within a rolling window N, satisfying mathematical boundary conditions.
- Threshold Constraints: Calculate the relative price difference between troughs to ensure they align within a strict tolerance window (e.g., within 1.5% of one another).
- Intermediate Peak Validation: Verify that an intervening peak (the neckline) exists with adequate height separation to prevent classifying flat consolidation as a reversal.
The Failure Modes of Pure Geometry
While computationally lightweight, rigid geometric rules encounter significant challenges in real-world market microstructure:
- Threshold Brittleness: If your tolerance threshold is 1.5% and a crypto asset prints a second trough at a 1.55% variance due to an intraday liquidity wick, a hardcoded rule discards the setup. Conversely, loosening the threshold introduces false positives.
- Temporal Invariance Issues: Formations unfold across varied velocity curves. A double bottom may develop symmetrically over 40 bars, or asymmetrically across 120 bars with consolidation before the second swing low. Rule-based heuristics struggle to model these time-elastic distortions without generating combinatorial parameter bloat.
- Context Blindness: A purely mathematical pattern detector cannot easily gauge whether a breakout candle was an aggressive, high-volume displacement bar or low-volume drift, unless engineers explicitly handcraft dozens of secondary conditional filters.
Enter Computer Vision: Treating Price Action as Visual Data
Computer vision models—specifically Convolutional Neural Networks (CNNs), Vision Transformers (ViTs), and multimodal Large Language Models (LLMs)—process technical charts as unified spatial representations rather than isolated numeric arrays. Academic research on financial time series, such as studies published on arXiv, demonstrates that converting numeric series into visual representations allows neural networks to capture multi-scale structural dependencies that classic tabular models overlook.
Spatial Encoding of Price Action
When an AI vision engine analyzes a chart, it processes spatial relationships between multiple visual components:
- Candle Body to Wick Ratios: The visual proportion of selling absorption versus continuous directional push.
- Support and Resistance Confluence: Visual clustering of price rejection zones across horizontal levels, trendlines, and dynamic indicator overlays.
- Indicator Synchronization: Simultaneous visual alignment between lower-pane oscillators (e.g., RSI divergence, MACD histogram contraction) and price candles.
Instead of checking hundreds of discrete logical branches, an AI vision model operates as a generalized feature extractor. It maps raw visual inputs to probability distributions across classified formations, outputting bounding coordinates, confidence metrics, and structural sentiment.
Architectural Comparison: Geometric Heuristics vs. Vision Models
To understand where each method fits within an institutional or fintech tech stack, consider their architectural characteristics:
- Primary Input: Traditional engines consume arrays of numeric vectors (OHLCV float arrays); AI vision models consume rendered image buffers or canvas streams.
- Inference Latency: Traditional heuristic calculations run in sub-millisecond speeds; AI vision inferences range from 80ms to 400ms depending on model infrastructure and GPU availability.
- Maintenance Cost: Heuristic engines require high ongoing manual refactoring for market edge cases; vision models maintain lower code complexity by learning structural variance during training.
- Multi-Timeframe Integration: Heuristic engines require complex relational code across discrete arrays; vision engines can inspect multi-pane canvas images directly.
Building a Production Hybrid Pipeline
In institutional trading systems and production fintech platforms, the goal is rarely to completely replace mathematical analysis with computer vision. Instead, the most resilient architectures use a two-stage hybrid pipeline:
- Stage 1 (Vector Filter): Use a high-throughput real-time market data REST API and vector indicators to screen thousands of tickers down to a high-probability watchlist (e.g., identifying assets with high relative volume, volatility compression, or key moving average tests).
- Stage 2 (Vision Verification): Generate standardized chart visualizations for the filtered assets and pass them to an AI trading signals API equipped with computer vision to confirm spatial structure, identify trendline geometry, and determine trade direction.
This hybrid pipeline limits GPU vision inference to assets that meet specific quantitative pre-conditions, reducing computational overhead while avoiding the blind spots of strict geometric filters.
Evaluating Systemic Risks and Execution Realities
While visual models streamline manual charting, engineers must approach them with systematic discipline. Pattern recognition is an exercise in probabilistic edge extraction, not deterministic prediction.
- Overfitting to Clean Renderings: Models trained exclusively on clean, high-resolution charts may experience accuracy degradation when presented with differing color schemes, indicator overlays, or varied aspect ratios. Standardize charting styles upstream.
- Execution Latency: If you run high-frequency trading (HFT) strategies requiring sub-millisecond execution, direct tick analysis on an order book remains the industry standard. Vision inference is best suited for execution windows measured in seconds, minutes, or hours.
- Sound Risk Parameters: Automated pattern detection should directly inform risk mechanics, such as setting dynamic stop levels below detected structural invalidation zones rather than using arbitrary percentage stops.
Scale Your Analysis with Trade AI
Modern financial markets move across multiple asset classes around the clock. Manual charting cannot monitor thousands of equities, currency pairs, and digital assets simultaneously. Relying solely on fragile code scripts leaves trading infrastructure susceptible to edge-case breakdown.
Trade AI combines low-latency infrastructure with visual intelligence. Whether you are building an automated trading desk, powering an active trader community, or launching algorithmic alert pipelines, explore our comprehensive suite of developer endpoints.
Explore our Trading Intelligence REST API & Webhooks, or contact our technical engineering team to integrate computer-vision pattern recognition into your production environment.
Frequently asked questions
- What is the difference between geometric technical analysis and AI chart vision?
- Geometric technical analysis relies on strict mathematical formulas applied to tabular price arrays (such as local extrema detection via ZigZag algorithms). AI chart vision renders the price action into a visual canvas and uses deep learning models (CNNs, ViTs) to detect patterns holistically, accounting for noise, asymmetric formations, and visual confluence.
- How fast is inference when using a chart pattern recognition API?
- While raw numerical indicator calculations take less than a millisecond, deep-learning vision inference typically completes in 80ms to 400ms depending on resolution, GPU batching, and API network transit. This latency profile makes it ideal for swing trading, automated screening, and intraday algorithmic alerts, though not for sub-millisecond high-frequency trading (HFT).
- Can I use AI vision alongside traditional indicators like RSI or MACD?
- Yes. Computer vision engines can process multi-pane charts where lower indicator panels (such as RSI divergence or MACD volume histograms) are visually aligned with price candles. In addition, hybrid architectures use numerical indicator filters before passing charts to the vision model.
- Does Trade AI require me to host and train computer vision models locally?
- No. Trade AI provides pre-trained, production-ready inference endpoints accessible via standard REST APIs and webhooks. You send standard chart images or trigger automated server-side chart rendering from our unified market data feeds.